
Running a marketing agency is not just about getting campaigns live. You also need to know what is happening across clients, channels, campaigns, KPIs, and reporting.
And this is where things can get messy.
One client needs Google Ads data. Another needs SEO numbers. Someone else wants social media performance. Your internal team needs a quick performance update. Before you know it, your team is jumping between dashboards, spreadsheets, analytics platforms, and reports just to answer one simple question:
“How are we actually performing?”
A good operational dashboard should make that question easier to answer.
The best operational agency dashboard gives agencies a clear view of the numbers that matter, brings data from different platforms together, and helps teams move from checking data to taking action. In 2026, agencies should look beyond attractive charts and focus on dashboards that support everyday operations, KPI tracking, performance reviews, client communication, and decision-making.
This guide explains what agencies should look for when choosing an operational agency dashboard and how platforms such as StatNexa can help simplify the process.
Table of Contents
- What Is an Operational Agency Dashboard?
- Why Agencies Need an Operational Dashboard
- What Makes the Best Operational Agency Dashboard?
- Key Features Agencies Should Look For
- Centralized Data
- KPI Tracking
- Custom Metrics
- Automated Reporting
- Period-over-Period Comparisons
- Multi-Client Management
- White-Label Reporting
- Easy Data Visualization
- Dashboard vs. Scorecard: What Is the Difference?
- How an Operational Dashboard Fits Into Agency Workflows
- What Should an Agency Dashboard Track?
- Common Mistakes When Choosing an Agency Dashboard
- How to Choose the Right Operational Agency Dashboard
- Why StatNexa Can Be Useful for Agency Operations
- Final Thoughts
- FAQs
What Is an Operational Agency Dashboard?
An operational agency dashboard is a centralized place where an agency can monitor important business, marketing, and client performance data.
Instead of checking several platforms separately, teams can use a dashboard to bring important information into one view.
For example, a digital marketing agency may work with:
- Google Ads
- Google Analytics
- Google Search Console
- Meta Ads
- SEO tools
- CRM platforms
- Ecommerce platforms
- Email marketing platforms
Each platform produces different data. The problem is not usually a lack of information. The problem is getting the right information together and understanding what needs attention.
An agency operations dashboard helps solve this by putting selected KPIs and performance information into a structured view.
The goal is not to display every available metric.
The goal is to display the metrics that help your team make better decisions.
Why Agencies Need an Operational Dashboard
Agency teams often spend a large amount of time collecting and organizing data.
A campaign manager checks advertising platforms. An SEO specialist checks rankings and traffic. An account manager prepares a client report. A manager wants an overall performance update.
When each person works with a different source of information, getting a complete picture can take time.
A centralized agency performance dashboard can make this process easier.
Reduce the Need to Switch Between Platforms
If your team has to open five or six platforms to prepare a simple performance update, reporting can quickly become a repetitive task.
A unified dashboard can bring relevant data into one place so teams spend less time collecting numbers.
Focus on Important KPIs
More data does not automatically mean better reporting.
An operational dashboard should help teams focus on the KPIs connected to their goals.
For example, a paid media campaign may focus on:
- Spend
- Impressions
- Clicks
- Conversions
- Cost per conversion
- Revenue
- ROAS
An SEO campaign may focus on:
- Organic traffic
- Clicks
- Impressions
- Rankings
- Conversions
- Leads
The dashboard should make these numbers easy to find and understand.
Make Performance Reviews Faster
A manager should not need to study a large spreadsheet just to understand whether performance changed.
A well-designed agency KPI dashboard can provide a quick snapshot of important metrics and comparisons.
This is particularly useful during weekly team meetings, monthly client reviews, and internal performance discussions.
What Makes the Best Operational Agency Dashboard?
There are many dashboard tools available, but agencies should not choose one simply because it looks good.
The best operational agency dashboard should fit the way your agency actually works.
Here are the main areas to evaluate.
Key Features Agencies Should Look For
1. Centralized Data From Multiple Platforms
Modern agencies rarely work with one marketing platform.
A good dashboard should allow you to bring information from different sources into a single reporting environment.
This reduces the need to manually combine numbers from different platforms.
StatNexa, for example, supports 90+ integrations and is designed to bring data from multiple business and marketing sources into a unified dashboard.
Why this matters
Imagine an agency managing a client running Google Ads, Meta Ads, SEO, and ecommerce campaigns.
Without a centralized system, the team may need to check each platform separately.
With a unified dashboard, important information can be viewed together.
That gives the account manager a better starting point for understanding overall performance.
2. KPI Tracking
A dashboard should make important KPIs easy to monitor.
The key word here is important.
You do not need 50 metrics on every screen.
A better approach is to select the metrics that directly relate to the client’s goals.
For example:
| Campaign Type | Important KPIs |
|---|---|
| PPC | Spend, clicks, conversions, CPA, ROAS |
| SEO | Traffic, clicks, impressions, rankings, conversions |
| Social Media | Reach, engagement, clicks, followers |
| Ecommerce | Revenue, orders, conversion rate, average order value |
| Lead Generation | Leads, CPL, conversion rate, qualified leads |
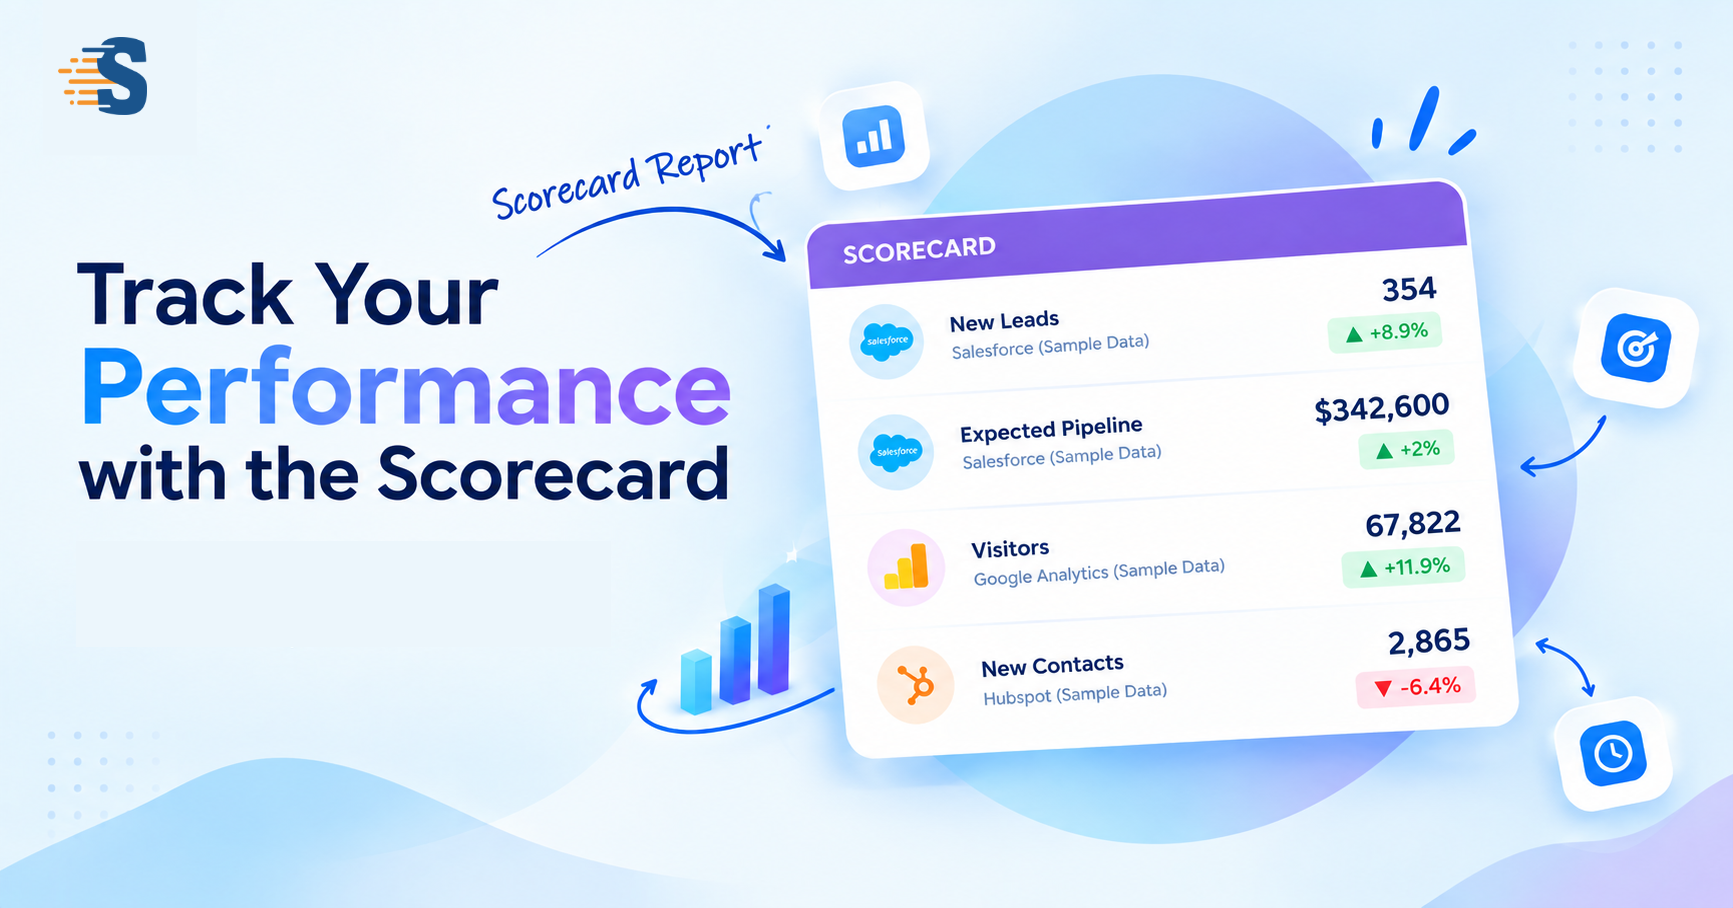
StatNexa’s Scorecard allows teams to select the metrics that matter to their goals instead of filling a report with unnecessary data.
3. Custom Metrics
Every agency has different reporting requirements.
One client may care about leads. Another may care about revenue. Another may have a custom KPI created specifically for their business.
This is why customizable metrics are important.
A flexible agency management dashboard should allow teams to select the dimensions and metrics that make sense for each client or campaign.
StatNexa also supports customizable dashboards and metrics, allowing agencies to build reporting views around specific business requirements.
4. Automated Reporting
Manual reporting can become one of the most repetitive tasks inside an agency.
Someone has to collect the data.
Someone has to organize it.
Someone has to check the numbers.
Someone has to prepare the report.
Then the same process starts again next week or next month.
Automation changes that workflow.
A useful dashboard should allow reports or scorecards to be scheduled and delivered automatically.
StatNexa Scorecards can be scheduled for daily, weekly, or monthly delivery and sent through email or posted to Slack.
Why automated delivery matters
The value of a dashboard is not only that data is available.
The data should reach the right people at the right time.
For example, an agency could schedule:
- Weekly internal performance updates
- Monthly client scorecards
- Campaign performance summaries
- KPI updates for management
This keeps reporting moving without requiring someone to manually send the same update every time.
5. Period-over-Period Comparisons
A single number rarely tells the full story.
If traffic is 20,000 visits, is that good?
It depends.
Was it 15,000 last month?
Was it 25,000 last month?
Is the business growing?
This is why comparisons matter.
A strong operational dashboard should make it easy to compare performance across periods.
StatNexa’s Scorecard supports period-over-period comparisons so teams can identify progress, slowdowns, and changes in performance without digging through large reports.
6. Multi-Client Management
Agency operations are different from managing one company’s marketing.
An agency may have ten, twenty, fifty, or more clients.
Each client can have different:
- Goals
- KPIs
- Data sources
- Reporting schedules
- Teams
- Access requirements
The dashboard should therefore make it practical to manage multiple client reporting workflows.
A marketing agency dashboard should help teams move between client accounts without rebuilding reports from scratch every time.
7. White-Label Reporting
Client-facing reporting is also part of the agency experience.
If your agency sends a report filled with another platform’s branding, it can make the reporting experience feel disconnected from your agency.
White-label functionality allows agencies to present dashboards and reports using their own branding.
StatNexa supports white-label dashboards, including branding options such as logos, custom layouts, and branded URLs.
8. Easy Data Visualization
A dashboard should not require a data analyst to understand every screen.
The layout should help people quickly identify:
- What changed?
- What is performing well?
- What needs attention?
- Which KPI moved?
- What should the team investigate?
StatNexa provides customizable widgets and dashboard layouts so agencies can choose how their information is displayed.
Dashboard vs. Scorecard: What Is the Difference?
Dashboards and scorecards are related, but they serve different purposes.
A dashboard usually provides a broader view of performance. It may include charts, tables, filters, detailed metrics, and multiple data sources.
A scorecard is more focused.
It highlights the most important KPIs in a simple summary.
Think of it this way:
Dashboard = Explore the data
Scorecard = Check the important numbers
For an agency, both can be useful.
A marketing manager may use a dashboard to investigate campaign performance, while an agency owner may want a quick scorecard showing the most important KPIs across accounts.
StatNexa’s Scorecard is designed around this focused approach, providing a concise performance snapshot rather than requiring users to browse through a full dashboard.
How an Operational Dashboard Fits Into Agency Workflows
The real value of an operational dashboard for agencies comes from how it fits into everyday work.
Consider a typical agency workflow.
Monday: Internal Performance Check
The team reviews the latest campaign numbers.
Instead of asking everyone to prepare separate updates, the manager checks the dashboard or scorecard.
Wednesday: Campaign Optimization
The paid media specialist notices that a KPI has changed compared with the previous period.
The team investigates the campaign and decides whether an adjustment is needed.
Friday: Client Update
The account manager reviews the latest numbers and prepares a client-facing update.
End of Month: Performance Review
The agency reviews broader trends and compares the month’s performance with the previous period.
The dashboard becomes part of the agency’s operating process rather than just another reporting tool.
What Should an Agency Dashboard Track?
There is no single list of metrics that every agency should use.
The right metrics depend on the service, client, and business objective.
Still, a useful agency analytics dashboard can include several categories.
Marketing Performance
- Traffic
- Leads
- Conversions
- Clicks
- Impressions
- Engagement
- Conversion rate
Paid Advertising
- Ad spend
- CPC
- CPA
- ROAS
- Impressions
- Click-through rate
- Conversions
SEO
- Organic traffic
- Search clicks
- Search impressions
- Rankings
- Organic conversions
- Landing-page performance
Ecommerce
- Revenue
- Orders
- Conversion rate
- Average order value
- Product performance
Business-Level Metrics
- Revenue
- Leads
- Customers
- Growth
- Conversion rate
- Return on investment
The key is to avoid turning the dashboard into a wall of numbers.
Common Mistakes When Choosing an Agency Dashboard
Choosing an operational dashboard based only on the number of features can create another problem: complexity.
Here are some mistakes agencies should avoid.
Choosing Too Many Metrics
More metrics can make a dashboard harder to use.
Choose KPIs based on the business objective instead.
Focusing Only on Design
A dashboard can look impressive and still be difficult to operate.
Check integrations, automation, customization, reporting, permissions, and data handling before making a decision.
Ignoring Automation
If your team still needs to manually copy numbers into spreadsheets every week, the dashboard may not be solving the actual reporting problem.
Creating the Same Dashboard for Every Client
Different clients have different goals.
A B2B lead-generation client should not necessarily receive the same dashboard as an ecommerce client.
Forgetting Internal Reporting
Many agencies think about client dashboards but forget their own operational needs.
An agency dashboard should also help managers understand team and campaign performance.
How to Choose the Right Operational Agency Dashboard
Before selecting a tool, ask these questions:
Does it connect to the platforms we already use?
Check whether your important data sources are supported.
Can we customize the KPIs?
You should be able to focus reports on the metrics that actually matter.
Can reports be automated?
Look for scheduled reporting and automatic delivery.
Can we compare performance over time?
Period-over-period comparisons can make changes much easier to spot.
Can we manage multiple clients?
If you are an agency, multi-client management should be part of your evaluation.
Can we create client-ready reports?
Look for customization and white-label options if reports are regularly shared with clients.
Is it easy for the team to use?
A powerful tool is not very useful if your team avoids using it because the workflow is complicated.
Why StatNexa Can Be Useful for Agency Operations
StatNexa is built around the idea of bringing marketing data, dashboards, reporting, and insights into one platform.
For agencies, the combination of dashboards and Scorecards can support two different needs.
The dashboard can provide a broader view of client and campaign performance, while the Scorecard can provide a focused summary of important KPIs.
StatNexa’s Scorecard can combine metrics from multiple platforms, show the latest available data, compare performance across periods, and automatically deliver updates through email or Slack.
StatNexa also provides customizable dashboards, multiple data sources, automated reports, white-label branding, customizable metrics, and client reporting capabilities.
For an agency trying to reduce repetitive reporting work, this can create a simpler workflow:
Connect data → Select KPIs → Build dashboard → Create scorecard → Schedule delivery → Review performance → Take action
The important part is that the dashboard should support the agency’s workflow rather than create another reporting task.
Final Thoughts
The best operational agency dashboard is not necessarily the one with the most charts, widgets, or features.
It is the one that helps your team answer important questions quickly.
What is happening?
What changed?
Which KPI needs attention?
Which client needs an update?
What should the team do next?
For agencies in 2026, the focus should be on centralized data, useful KPIs, customization, automation, comparisons, multi-client management, and clear reporting.
A dashboard should reduce the work required to understand performance—not add another layer of work.
And when dashboards, scorecards, automated reports, and multiple data sources work together, agencies can spend less time collecting numbers and more time using those numbers to improve campaigns and client results.
FAQs
What is the best operational agency dashboard?
The right operational agency dashboard depends on an agency’s clients, data sources, KPIs, reporting requirements, and workflow. Agencies should evaluate integrations, customization, automation, multi-client support, comparisons, and reporting options before choosing a platform.
What should an operational agency dashboard include?
An operational agency dashboard should include the KPIs that matter to the agency and its clients. Depending on the service, this can include leads, revenue, traffic, conversions, ad spend, ROAS, SEO performance, engagement, and other business metrics.
What is an agency KPI dashboard?
An agency KPI dashboard is a reporting interface that brings important performance indicators into one place. It allows agency teams and managers to monitor campaign or business performance without checking every data source separately.
What is the difference between an agency dashboard and a scorecard?
An agency dashboard generally provides a broader view with charts, tables, widgets, and detailed performance data. A scorecard focuses on a smaller set of important KPIs and provides a quick performance snapshot.
Can an operational dashboard automate agency reporting?
Yes. Depending on the platform, agencies can automate report creation and delivery. For example, StatNexa Scorecards can be scheduled for daily, weekly, or monthly delivery through email or Slack.
Why do agencies need a centralized reporting dashboard?
Agencies often work with data from multiple marketing platforms. A centralized dashboard can reduce the need to switch between platforms and manually combine data, giving teams a more consistent view of performance.
What should agencies consider before choosing a dashboard?
Agencies should consider integrations, KPI customization, automation, data freshness, period comparisons, multi-client support, white-label capabilities, ease of use, and the overall reporting workflow.
Is StatNexa an operational agency dashboard?
StatNexa provides customizable marketing dashboards, reporting, Scorecards, multiple data integrations, automated reporting, and white-label capabilities designed for businesses and marketing agencies. Its Scorecard feature provides a focused view of important KPIs and can automatically deliver performance updates.