

Imagine managing marketing for an advertising agency where revenue has declined for three consecutive months. The team is still spending money on campaigns, generating leads, and sending reports to clients. Yet, the numbers are moving in the wrong direction.
That was the challenge facing Michael Carter, the fictional Head of Marketing at an advertising agency in Austin, Texas.
Michael was responsible for monitoring campaign performance, managing marketing budgets, and helping the agency understand whether its marketing activities were delivering results. His team collected data from advertising platforms, website analytics, and lead-generation campaigns. However, the reports were scattered across different tools, making it difficult to connect advertising expenditure with qualified leads, conversions, and revenue.
The problem was not a lack of data. It was the difficulty of understanding what that data meant for the business.
Michael needed a clearer way to compare marketing performance, identify changes in important metrics, and investigate why revenue was declining while advertising expenditure continued to rise.
He decided to organize the investigation around a marketing scorecard.
This case study explores how Michael used marketing KPI tracking, performance comparisons, and a structured reporting process to identify potential problems and plan his next steps.

Meet Michael Carter: The Marketing Head Facing a Revenue Challenge
Michael worked at a fictional mid-sized advertising agency that managed digital campaigns for businesses across different industries. His team handled paid advertising, search engine optimization, social media marketing, and lead generation.
As Head of Marketing, Michael needed to understand more than how many clicks or leads a campaign generated. He also needed to know whether those activities were contributing to business goals.
The agency’s leadership expected regular updates on revenue, advertising costs, campaign results, and client performance. Michael had to turn information from multiple sources into a clear picture of what was happening.
Managing multiple campaigns, clients, and marketing channels
Each marketing channel provided a different view of performance.
Google Ads reports showed campaign spending, clicks, and conversions. Website analytics provided information about traffic and user behavior. Social media platforms reported engagement and campaign results, while lead-management systems helped the team track prospects.
Individually, these reports were useful. The difficulty came when Michael tried to compare them and understand how the numbers connected.
For example, a campaign might generate more leads without producing more paying customers. Another might receive fewer clicks but attract prospects who were more likely to convert.
Without reviewing the metrics together, it was easy to focus on activity instead of business results.
Why separate marketing reports were not giving Michael clear answers
Michael’s team spent considerable time collecting figures, preparing spreadsheets, and reviewing individual platform reports.
By the time the monthly summary was ready, the team could see that revenue had declined, but it could not immediately explain why.
Michael realized that the agency needed a consistent reporting process with clearly defined KPIs, comparable reporting periods, and a way to highlight the metrics that required attention.
Suggested visual 2: Create an infographic showing Google Ads, website analytics, social media, and CRM data flowing into one centralized marketing analytics dashboard.
Three Months of Declining Revenue: What the Marketing Data Revealed
Michael started by comparing three consecutive reporting periods. Rather than focusing on revenue alone, he included advertising expenditure, qualified leads, and the lead-to-customer conversion rate.
The following table represents the agency’s fictional performance data.
| Marketing metric | Month 1 | Month 2 | Month 3 |
|---|---|---|---|
| Revenue | $120,000 | $108,000 | $96,000 |
| Advertising spend | $30,000 | $32,000 | $34,000 |
| Qualified leads | 480 | 420 | 350 |
| Lead-to-customer conversion rate | 5.0% | 4.4% | 3.8% |
All figures are illustrative. Revenue refers to the fictional agency’s reported revenue for each period. Advertising spend is shown separately and should not automatically be treated as the sole cause of revenue changes.
Revenue declined while advertising expenditure increased
The first comparison revealed a worrying pattern.
Between Month 1 and Month 3, revenue fell from $120,000 to $96,000, a decline of 20%. During the same period, advertising expenditure increased from $30,000 to $34,000, a rise of approximately 13.3%.
The agency was spending more on advertising while generating less revenue.
That did not prove that advertising campaigns were responsible for the decline. Other factors, including client churn, pricing changes, sales performance, or changes in revenue recognition, could also have contributed.
However, the figures gave Michael a clear reason to investigate marketing efficiency and the relationship between campaign activity and business results.
Qualified leads and conversion rates were also falling
Qualified leads declined from 480 to 350, a decrease of approximately 27.1%.
The lead-to-customer conversion rate dropped from 5.0% to 3.8%, a reduction of 1.2 percentage points.
These changes suggested that the agency needed to investigate both the number and the quality of leads it was generating.
If fewer qualified prospects were entering the sales pipeline, and a smaller percentage of leads were becoming customers, the problem could extend beyond advertising costs.
Why Michael needed to review all four metrics together
Revenue showed the outcome, advertising spend showed the investment, qualified leads showed the number of promising opportunities, and conversion rate indicated how effectively leads became customers.
Together, these metrics provided a stronger starting point for the investigation than any one figure could provide alone.
Suggested visual 3: A four-panel marketing analytics chart showing the decline in revenue, increase in ad spend, decline in qualified leads, and decline in conversion rate over three months.
The Hidden Marketing Problems Michael Needed to Investigate
The initial scorecard comparisons helped Michael identify where to ask questions. They did not automatically identify the root cause.
He created a list of possible explanations and began checking the underlying campaign and sales data.
Lower lead quality could be reducing campaign value
One possibility was that some campaigns were attracting people who were unlikely to become customers.
A campaign can generate clicks and form submissions without producing qualified business opportunities. Broad audience targeting, weak search intent, or an offer that attracts low-intent visitors can contribute to this problem.
Michael needed to compare lead quality across channels and campaigns instead of judging performance by lead volume alone.
He also needed to understand which lead sources produced qualified prospects and which ones produced customers.
Falling conversion rates could be creating a gap between leads and revenue
The lower conversion rate raised another question: were leads failing to convert because of the marketing experience, or was the problem occurring later in the sales process?
Possible areas to examine included landing-page relevance, form completion, offer clarity, lead response times, and sales follow-up.
For example, if a landing page attracted the right audience but the sales team took several days to respond, the issue might not be the advertising campaign itself.
Michael therefore needed to review both marketing and sales data before deciding which changes to make.
Rising advertising costs could be affecting marketing efficiency
Higher advertising expenditure does not necessarily produce better results.
Michael wanted to compare cost per lead, customer acquisition cost, and return on ad spend where the relevant data was available.
These metrics could help him determine whether the agency was paying more to generate leads, acquiring fewer customers from its leads, or experiencing a combination of both problems.
He also needed to check attribution carefully. Revenue should not be credited to a campaign without a consistent method for connecting marketing activity to business outcomes.
Disconnected reports were slowing down the investigation
The agency’s reporting process made it difficult to see these relationships quickly.
Each platform showed part of the picture, but Michael needed a consistent way to compare metrics across reporting periods and identify which areas required a closer look.
The marketing scorecard became the starting point for that process.
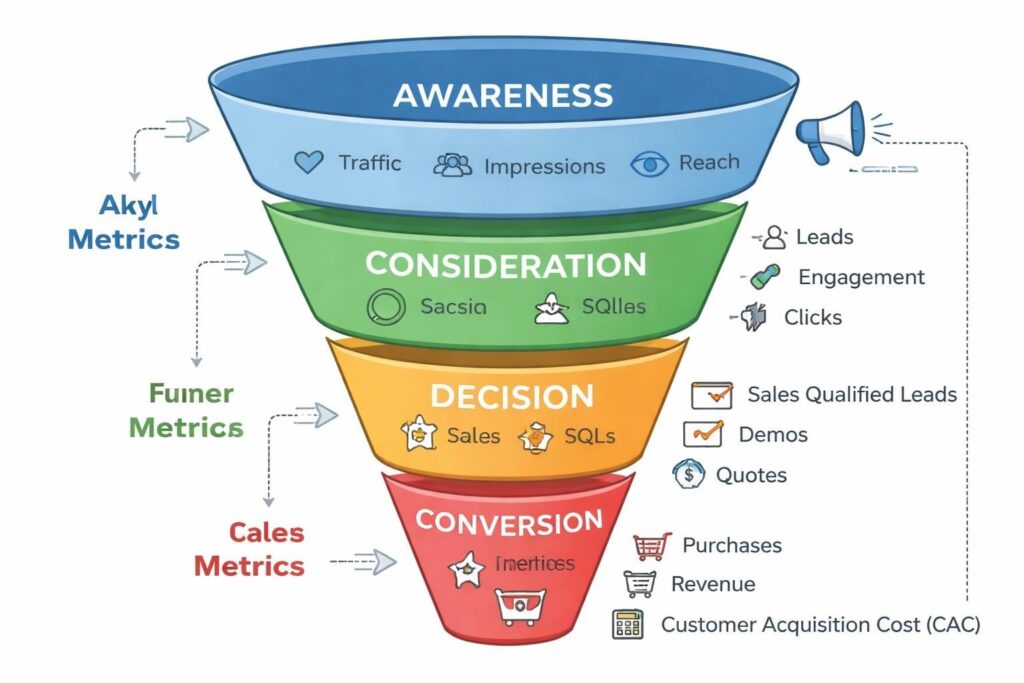
How Michael Used Marketing KPI Tracking to Structure His Investigation
Michael decided that the agency needed more than a monthly summary. It needed a repeatable process for reviewing performance, investigating changes, and assigning actions.
Step 1: Identify the KPIs that connect marketing activity with revenue
Michael selected a core group of marketing performance metrics.
These included revenue, advertising spend, qualified leads, lead-to-customer conversion rate, cost per lead, customer acquisition cost, and return on ad spend where applicable.
He also made sure each metric had a clear definition, reporting period, and data source.
This mattered because two reports can show different results when they use different attribution models, date ranges, or definitions of a qualified lead.
Consistent definitions would make future comparisons more meaningful.
Step 2: Compare actual performance against targets and previous months
Michael wanted to understand not only whether a number had increased or decreased, but also whether it was meeting expectations.
He introduced comparisons between actual results and monthly targets. He also reviewed month-over-month changes to identify trends that might otherwise be missed.
For example, the revenue decline became more concerning when viewed alongside rising advertising spend and falling qualified leads.
A single monthly figure could not show the full pattern. Comparing all three periods helped the team see how the problem had developed.
Step 3: Investigate the campaigns and channels behind the changes
After identifying the declining KPIs, Michael reviewed campaign-level information.
He planned to compare lead quality by channel, investigate conversion performance on key landing pages, and review the sources of qualified leads.
The objective was to determine whether the decline was concentrated in a few campaigns or reflected a broader problem.
If one channel had become less efficient, the team could investigate it specifically. If performance had deteriorated across multiple channels, a wider review of targeting, offers, sales follow-up, and attribution might be necessary.
Step 4: Assign corrective actions and review the next reporting period
Michael also wanted every investigation to lead to a clear next step.
The team documented the issue, agreed on an action, assigned an owner, and established a review date.
This prevented the monthly reporting meeting from becoming a discussion of numbers without a plan for what to do next.
Suggested visual 5: A four-step process diagram showing Define KPIs → Compare Performance → Investigate Causes → Track Corrective Actions.
What a Marketing Performance Scorecard Should Show When Revenue Starts Falling
For Michael, the scorecard needed to make important changes easy to identify without replacing detailed campaign analysis.
A useful marketing performance scorecard should focus on metrics that help the team understand progress toward its business goals.
Revenue, ad spend, qualified leads, and conversion rates in one view
These four metrics provided the foundation of Michael’s review.
Revenue showed the financial outcome. Advertising spend indicated how much was being invested. Qualified leads provided insight into the sales pipeline, while conversion rates helped the team assess how effectively leads became customers.
Reviewing these measures together helped Michael identify the relationships that required further investigation.
For instance, falling revenue alongside declining qualified leads called for a different investigation than falling revenue accompanied by stable leads and conversion rates.
KPI targets, actual results, and month-over-month changes
A scorecard becomes more useful when it provides context for each number.
Michael wanted to compare actual results against agreed targets and previous reporting periods. Where appropriate, he also wanted percentage changes and clear indicators of whether performance was moving in the expected direction.
These comparisons helped the team prioritize the metrics that required attention.
However, a status indicator alone could not explain why a KPI had changed. The team still needed to examine the underlying data.
Regular scorecard reviews can support better marketing decisions
Michael planned to review the scorecard on a consistent schedule rather than waiting until the end of each month to assemble separate reports.
Regular reviews could help the agency identify emerging problems sooner, ask better questions, and track whether corrective actions were having the intended effect.
The aim was not to monitor every possible metric. It was to focus attention on the numbers that mattered most to the agency’s business goals.
Suggested visual 6: Insert a real StatNexa scorecard screenshot if available. Otherwise, use an illustrative mockup with the four KPIs, reporting periods, comparison values, and status indicators. Clearly label generated data as fictional.
The Corrective Actions Michael Recommended After Reviewing the Scorecard
The scorecard helped Michael organize the investigation, but he knew that changing the advertising budget immediately would be premature.
He recommended a set of actions based on the areas that required further investigation.
Investigate campaigns generating leads but few customers
Michael planned to compare the performance of individual campaigns by lead quality, conversion rate, and customer acquisition cost.
Campaigns producing many leads but few customers would receive closer scrutiny.
The team would examine audience targeting, campaign intent, lead qualification criteria, and the quality of the opportunities being passed to sales.
If the evidence showed that a campaign was attracting the wrong audience, the team could test changes to targeting, messaging, or landing-page relevance.
Review landing pages and the lead follow-up process
The team would also investigate whether potential customers were encountering problems after clicking an advertisement.
This included reviewing landing-page content, form completion, mobile usability, and the clarity of the offer.
Michael also wanted to examine how quickly sales representatives responded to qualified leads.
By reviewing the complete journey from advertisement to customer, the agency could avoid blaming advertising campaigns for problems occurring elsewhere in the process.
Adjust advertising budgets only after validating the data
Rather than immediately cutting budgets, Michael recommended identifying the campaigns that required testing or closer monitoring.
Budget changes would be based on evidence about campaign quality, conversion performance, and business outcomes.
Where appropriate, the team could test changes on a limited scale and compare results before making broader decisions.
This approach reduced the risk of cutting campaigns that generated valuable customers simply because their lead volume looked lower.
Assign owners and deadlines to every corrective action
Michael introduced a simple action plan to keep the investigation moving.
| Area to investigate | Planned action | Responsible team | Review point |
|---|---|---|---|
| Lead quality | Compare qualified leads by channel | Marketing | Next reporting review |
| Landing pages | Review form completion and relevance | Marketing | After testing |
| Lead follow-up | Check response times and conversion outcomes | Sales | Next reporting review |
| Campaign efficiency | Compare cost and customer outcomes | Paid media | After data validation |
This plan gave the team a practical way to move from reporting problems to investigating them.
The next reporting period would show whether the changes improved performance. Until then, Michael avoided claiming that the revenue decline had been resolved.
How StatNexa Scorecards Can Support a Better Marketing Reporting Workflow
Michael’s scenario illustrates why advertising agencies need a structured way to monitor KPIs and review performance changes.
StatNexa offers marketing analytics and reporting features that can support this workflow by helping teams organize metrics, review dashboards, and manage recurring reports.
Track important marketing KPIs in a structured scorecard
Instead of repeatedly assembling the same summary from separate reports, marketing teams can use StatNexa Scorecards to organize selected metrics into a structured performance view.
For an agency investigating declining revenue, relevant measures may include revenue, advertising spend, leads, conversion rates, and other connected business metrics, depending on the available integrations and data.
A structured scorecard helps the team review important measures consistently. It does not automatically determine the cause of a decline, but it can help highlight the areas that deserve further analysis.
Explore the StatNexa Scorecard documentation to learn more.
Compare reporting periods and identify changes in performance
Comparing reporting periods can help marketing teams identify increases, decreases, and gaps against targets.
For Michael, this would mean regularly checking whether revenue, qualified leads, and conversion rates were improving or continuing to decline.
The team could then investigate the campaigns or business processes behind those changes.
Schedule scorecards for email or Slack delivery
Regular reporting can become difficult when team members depend on manual reminders and report sharing.
StatNexa’s scorecard workflow supports scheduled delivery through email or Slack, helping teams incorporate reporting into their regular review process.
This can make it easier to share performance summaries with the relevant people and prepare for marketing meetings.
Combine scorecards with marketing dashboards and automated reports
Scorecards, dashboards, and automated reports serve related but different purposes.
- Scorecards help organize and review selected performance metrics.
- Marketing dashboards provide a broader view of data and performance across connected sources.
- Automated reporting helps teams streamline recurring report preparation and distribution.
Together, these capabilities can support a more consistent reporting workflow for agencies managing multiple campaigns and clients.
Explore the StatNexa marketing analytics and dashboard features and automated reporting features to understand how they may fit your team’s needs.
If your agency also needs to improve its search performance reporting, explore StatNexa’s SEO reporting solutions.
If your team spends too much time collecting reports and not enough time investigating performance, StatNexa can help bring important marketing metrics into a more structured reporting workflow.
Book a StatNexa demo to explore the platform and see whether its scorecards, dashboards, and reporting features fit your agency’s needs.
Conclusion:
Michael Carter’s fictional experience highlights a common challenge for advertising agencies: revenue can decline even when marketing activity and advertising expenditure remain high.
The first step toward understanding the problem is to look beyond individual metrics. Revenue, advertising spend, qualified leads, and conversion rates provide a more useful picture when reviewed together.
A marketing scorecard helps organize these KPIs, compare reporting periods, and highlight performance gaps that deserve further investigation. It also gives marketing teams a consistent starting point for assigning actions and reviewing progress.
However, a scorecard cannot replace deeper analysis. Identifying the actual cause of declining revenue requires reliable data, campaign-level investigation, and collaboration between marketing and sales.
For agencies looking to improve their reporting process, StatNexa’s scorecards and marketing analytics features offer a practical place to start.
Explore StatNexa or book a demo to see how structured marketing reporting could fit into your workflow.