
A client asks, “How are our social media campaigns performing?”
Your team opens Instagram. Then Facebook. Then LinkedIn. Then YouTube. After that, someone pulls numbers into a spreadsheet, checks last month’s report, calculates engagement rates, and starts writing insights.
By the time the report is ready, three hours are gone.
And the worst part?
You may still not have a clear answer to the question that actually matters:
Is social media helping the client reach their business goals?
This is where a Social Media KPI Dashboard can make a major difference.
Instead of jumping between platforms and spreadsheets, agencies can bring the most important social media metrics into one place. A well-designed KPI Dashboard makes it easier to see what is working, what is falling behind, and where the next opportunity may be.
But there is a catch.
More metrics do not mean better reporting.
An agency could track dozens of numbers every month and still fail to show the client what really matters.
The goal is not to fill a dashboard with data. The goal is to turn social media data into a clear story about performance, progress, and business impact.
In this guide, we’ll cover the most important social media KPIs agencies should track, how to organize them in a KPI Dashboard, common mistakes to avoid, and how to build reports that clients can actually understand.
What Is a Social Media KPI Dashboard?
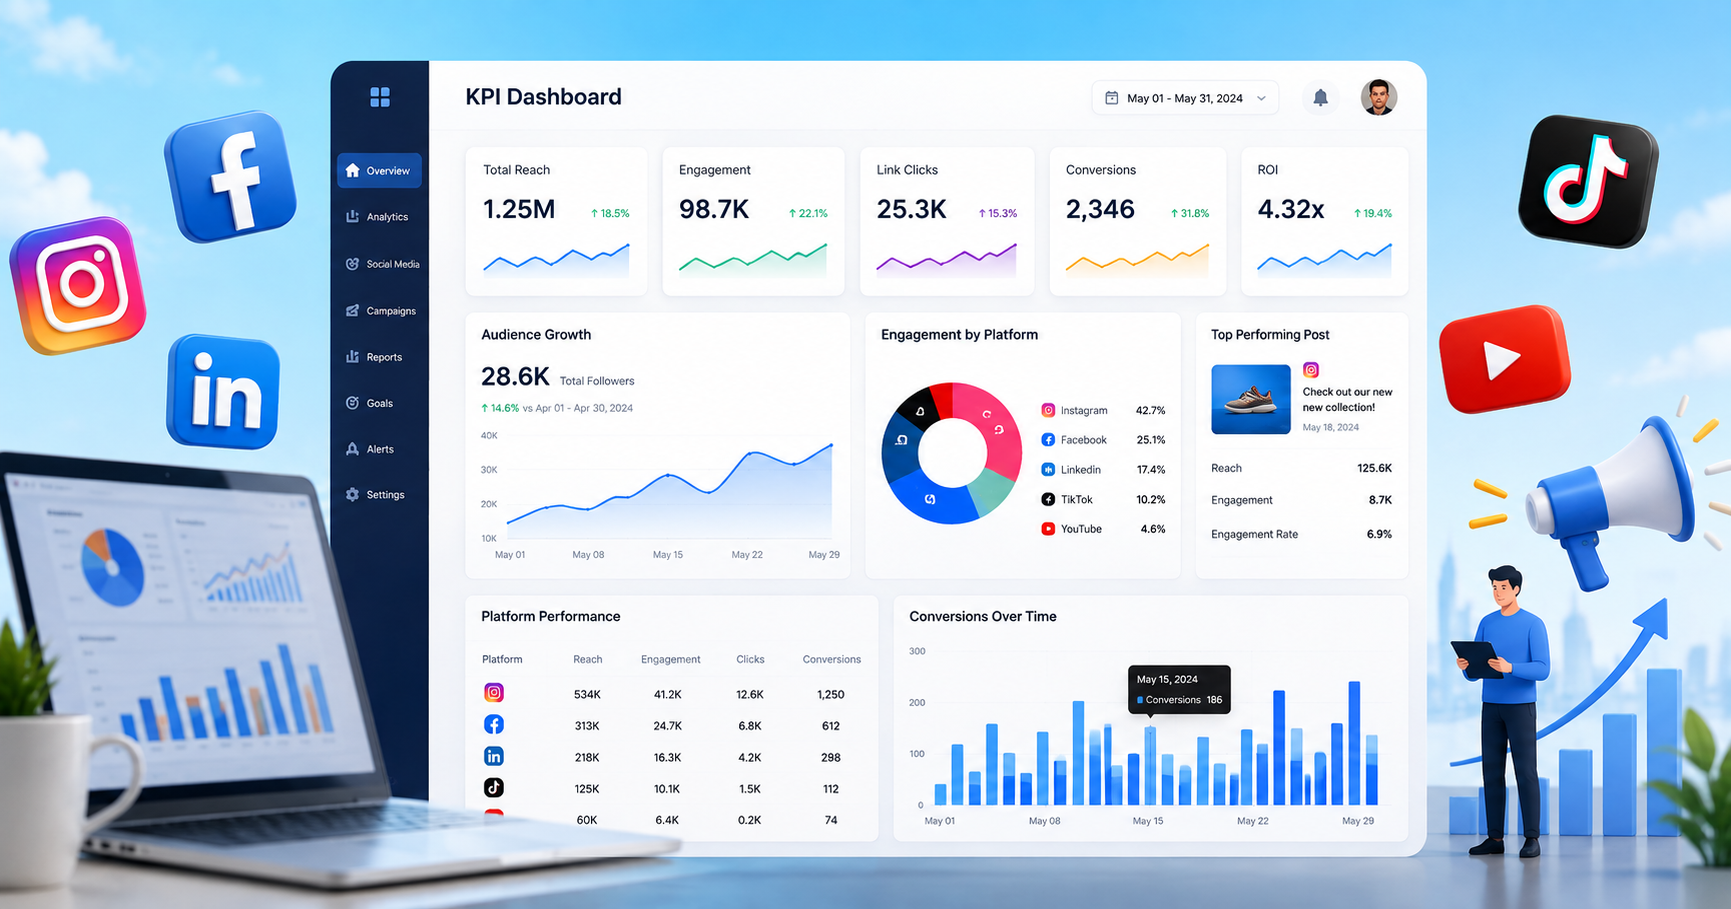
A Social Media KPI Dashboard is a visual reporting system that brings important social media performance metrics into one place.
Instead of checking each platform separately, agencies can use a dashboard to monitor metrics such as:
- Reach
- Impressions
- Engagement
- Engagement rate
- Follower growth
- Clicks
- Website traffic
- Leads
- Conversions
- Cost per result
- Return on ad spend
A traditional social media report may show what happened during a specific reporting period.
A KPI Dashboard goes a step further by helping teams continuously monitor performance and compare results against previous periods or targets.
For example, an agency might see:
| KPI | This Month | Last Month | Change |
|---|---|---|---|
| Reach | 185K | 142K | +30% |
| Engagement | 12.4K | 9.8K | +27% |
| Followers | 28.5K | 26.9K | +6% |
| Website Clicks | 4,250 | 3,410 | +25% |
| Leads | 186 | 141 | +32% |
Instead of simply saying, “Social media performance improved,” the agency can show exactly where the improvement happened.
That makes reporting more useful for both the agency and the client.
Why Agencies Need a Social Media KPI Dashboard
Managing social media for one brand can involve multiple platforms, campaigns, content types, audiences, and goals.
Now imagine doing that for 10, 20, or 50 clients.
Manual reporting quickly becomes a problem.
A Social Media KPI Dashboard which shows real growth engine can help agencies solve several common reporting challenges.
1. Save Time on Reporting
One of the biggest problems for agencies is the amount of time spent collecting data.
A team may need to:
- Log into each social platform.
- Export performance data.
- Copy numbers into spreadsheets.
- Calculate percentage changes.
- Create charts.
- Check the numbers.
- Write insights.
- Format the client report.
A centralized KPI Dashboard can reduce much of this manual work.
Your team can spend less time collecting numbers and more time understanding what those numbers mean.
2. See Performance in One Place
Clients rarely care about which platform you had to open to find a number.
They care about results.
A dashboard can bring Instagram, Facebook, LinkedIn, TikTok, YouTube, and other channels into a single reporting view when the required integrations are available.
That gives the agency a broader picture of social media performance.
3. Spot Problems Faster
A monthly report may tell you that engagement dropped by 18%.
A dashboard can help you notice that trend much earlier.
For example:
Reach ↑ 22%
Followers ↑ 8%
Engagement ↓ 15%
That combination tells a different story.
The content is reaching more people, but fewer people are interacting with it.
That could be a signal to review content quality, audience targeting, creative formats, or calls to action.
4. Make Client Meetings More Valuable
Instead of spending the first 20 minutes explaining where the numbers came from, agencies can focus on what the numbers mean.
A good KPI Dashboard helps move the conversation from:
“Here are your numbers.”
to:
“Here is what changed, why it changed, and what we’re doing next.”
That’s a much stronger client conversation.
The Social Media KPIs Every Agency Should Track
Not every client needs the same metrics.
A B2B software company may care about leads and website traffic.
An ecommerce brand may care about purchases and revenue.
A local business may care about calls, messages, and store visits.
So the best approach is to organize KPIs around the client’s actual goals.
Here are the core metrics most agencies should consider.
1. Reach
Reach measures the number of unique users who saw your content.
If your content reached 100,000 people, that means approximately 100,000 unique accounts were exposed to it during the selected period.
Reach is useful for understanding:
- Brand awareness
- Audience growth
- Content distribution
- Campaign exposure
However, reach alone doesn’t tell you whether people liked, shared, clicked, or purchased.
That’s why it should not be treated as a standalone success metric.
Example
Suppose a campaign generates:
Reach: 500,000
That sounds impressive.
But if it generates only:
20 clicks and 2 leads
the campaign may not be delivering the business outcome the client wants.
Reach tells you how many people saw the content.
Other KPIs tell you what happened next.
2. Impressions
Impressions measure how many times content was displayed.
Unlike reach, the same person can generate multiple impressions.
For example, if 10,000 people see a post twice, you could have:
- Reach: 10,000
- Impressions: 20,000
Impressions are particularly useful for understanding content exposure and frequency.
Agencies can use them to identify whether campaigns are generating enough visibility or whether audiences may be seeing the same content repeatedly.
3. Engagement
Engagement measures how users interact with social content.
Depending on the platform, engagement can include:
- Likes
- Comments
- Shares
- Saves
- Reactions
- Video interactions
- Other platform-specific actions
Engagement helps agencies understand whether content is getting a response from the audience.
For example, a post with 100,000 impressions but only 200 interactions may need a different strategy from a post with 20,000 impressions and 2,000 interactions.
The second post may have a much stronger connection with the audience.
4. Engagement Rate
Engagement rate puts engagement into context.
Instead of looking only at the number of interactions, agencies can evaluate engagement relative to reach, impressions, followers, or another relevant base.
A simple version can be represented as:
Engagement Rate = Engagements ÷ Reach × 100
The exact calculation can vary depending on the platform and reporting method.
Engagement rate is often more useful than raw engagement because it helps compare content with different audience sizes.
For example:
Post A: 5,000 engagements from 200,000 reach
Post B: 2,000 engagements from 30,000 reach
Post A has more engagement.
But Post B may have generated a stronger response relative to its reach.
That’s the kind of insight an agency should surface in its KPI Dashboard.
5. Follower Growth
Follower growth shows whether an account is building its audience over time.
Track:
- New followers
- Unfollows
- Net follower growth
- Follower growth rate
Don’t treat follower growth as the ultimate measure of success.
A brand can gain thousands of followers without generating meaningful business results.
Instead, connect audience growth with other KPIs.
For example:
Follower growth ↑
Website traffic ↑
Leads ↑
That’s more meaningful than follower growth alone.
6. Click-Through Rate
Click-through rate, or CTR, measures how often users click after seeing an ad or content element.
CTR can help agencies understand whether their content and calls to action are encouraging users to take the next step.
A low CTR may indicate problems with:
- Creative
- Messaging
- Offer
- Audience targeting
- Call to action
- Landing page alignment
CTR becomes particularly important when the client’s social strategy is designed to drive website traffic.
7. Website Traffic From Social Media
Social media should not always be judged only by what happens inside the platform.
For many businesses, the real goal is to move users from social media to their website with data.
Track metrics such as:
- Sessions from social
- Users from social
- Landing page visits
- Traffic by platform
- Traffic by campaign
- Conversions from social traffic
This helps connect social media activity with website performance.
For example, an agency might discover that LinkedIn generates less traffic than Instagram but produces significantly more qualified leads.
That insight could change where the agency spends its time.
8. Leads Generated
For lead-generation campaigns, leads are far more important than likes.
Track:
- Total leads
- Leads by platform
- Leads by campaign
- Leads by content
- Cost per lead
- Qualified leads
This helps answer the question clients actually care about:
“Is social media generating potential customers?”
A KPI Dashboard should make that answer easy to find.
9. Conversions
Leads are valuable, but conversions take the analysis further.
Depending on the business, a conversion could mean:
- Purchase
- Demo booking
- Form submission
- Subscription
- Registration
- Phone call
- App download
Agencies should define the conversion before deciding which KPI belongs on the dashboard.
Otherwise, teams may optimize for activity rather than outcomes.
10. Cost Per Result
For paid social campaigns, cost metrics are essential.
Track metrics such as:
- Cost per click
- Cost per lead
- Cost per acquisition
- Cost per conversion
These metrics help agencies understand whether campaign spending is producing efficient results.
A campaign generating 500 leads isn’t automatically successful if each lead costs significantly more than the client’s acceptable acquisition cost.
11. Return on Ad Spend
For ecommerce and revenue-focused campaigns, ROAS can be one of the most important KPIs.
A simple calculation is:
ROAS = Revenue Generated ÷ Advertising Spend
For example, if a campaign generates $20,000 in attributed revenue from $5,000 in ad spend:
ROAS = 4x
This gives the client a much clearer view of advertising efficiency than impressions or likes alone.
KPI Dashboard Metrics by Social Media Goal
The right KPIs depend on what the client wants to achieve.
If the goal is brand awareness
Focus on:
- Reach
- Impressions
- Video views
- Follower growth
- Audience growth
- Brand mentions
If the goal is engagement
Focus on:
- Engagement
- Engagement rate
- Comments
- Shares
- Saves
- Reactions
If the goal is website traffic
Focus on:
- Clicks
- CTR
- Social sessions
- Landing page visits
- Traffic by platform
If the goal is lead generation
Focus on:
- Leads
- Qualified leads
- Cost per lead
- Conversion rate
- Lead-to-customer rate
If the goal is ecommerce sales
Focus on:
- Purchases
- Revenue
- Conversion rate
- CPA
- ROAS
- Average order value
This is why there is no single list of “perfect” social media KPIs.
The best KPI Dashboard is the one connected to the client’s goal.
Social Media KPI Dashboard Example for an Agency
Imagine a digital marketing agency manages social media for an ecommerce client.
The client’s main goal is to increase online sales.
Instead of creating a dashboard with 30 social metrics, the agency could organize it into four sections.
Section 1: Visibility
- Reach
- Impressions
- Video views
Section 2: Engagement
- Engagement rate
- Shares
- Saves
- Comments
Section 3: Traffic
- Link clicks
- CTR
- Social website sessions
Section 4: Revenue
- Purchases
- Revenue
- Cost per purchase
- ROAS
This structure tells a simple story:
Did people see the content?
↓
Did they interact with it?
↓
Did they visit the website?
↓
Did they buy?
That’s far more useful than presenting a wall of numbers.
How to Build a Social Media KPI Dashboard
Creating a useful dashboard doesn’t start with choosing charts.
It starts with understanding the business.
Step 1: Define the Client’s Goal
Ask:
What does the client actually want social media to accomplish?
Is it awareness?
Engagement?
Traffic?
Leads?
Sales?
The answer determines the KPIs.
Step 2: Choose the Most Important KPIs
Don’t track every metric available.
Choose the metrics that help measure progress toward the goal.
A good starting point is around 5-10 primary KPIs, with supporting metrics available when deeper analysis is needed.
Step 3: Identify Data Sources
Depending on the campaign, data may come from:
- TikTok
- YouTube
- Google Analytics
- Advertising platforms
- CRM systems
- Ecommerce platforms
Bringing these sources together can make reporting much easier.
Step 4: Set Targets
Numbers become more useful when there is something to compare them against.
For example:
Target engagement rate: 5%
Actual: 6.2%
Now the client can immediately see that performance is above target.
Step 5: Add Comparisons
Show:
- Current period
- Previous period
- Year-over-year performance
- Target
- Percentage change
Comparisons turn isolated numbers into trends.
Step 6: Add Visualizations
Use charts when they help explain the data.
For example:
- Line chart for follower growth
- Bar chart for platform comparison
- Scorecards for primary KPIs
- Trend charts for traffic
- Tables for campaign-level analysis
Avoid adding charts simply because they look attractive.
Every visual should answer a question.
Social Media KPI Dashboard vs. Traditional Social Media Report
Both can be useful, but they serve different purposes.
| KPI Dashboard | Traditional Report |
| Designed for ongoing monitoring | Usually created for a reporting period |
| Can centralize multiple data sources | Often relies on exported data |
| Makes trends easier to spot | Often focuses on historical results |
| Can reduce manual reporting | May require more manual work |
| Interactive in many setups | Often static |
| Useful for quick decision-making | Useful for formal client summaries |
The strongest agency reporting strategy may use both.
The dashboard helps teams monitor performance.
The client report can explain the results, insights, and next actions.
Common Social Media KPI Dashboard Mistakes
A dashboard can have beautiful charts and still be completely unhelpful.
Here are some mistakes agencies should avoid.
Tracking Too Many Metrics
More data does not automatically mean better insights.
If every available metric appears on the dashboard, the important numbers become harder to find.
Fix: Prioritize KPIs based on the client’s goals.
Focusing Only on Vanity Metrics
Likes and followers can be useful.
But they shouldn’t automatically be treated as business results.
Fix: Connect engagement metrics with traffic, leads, conversions, or revenue where appropriate.
Ignoring Trends
A single number doesn’t tell you much.
A 10,000-click month may sound good until you discover the previous month had 15,000 clicks.
Fix: Include period-over-period comparisons.
Not Setting Targets
Without a target, it’s difficult to know whether performance is actually good.
Fix: Add realistic benchmarks or campaign targets.
Making the Dashboard Too Complicated
Clients shouldn’t need a training session just to understand the first page.
Fix: Put the most important information first and keep the design simple.
Reporting Without Insights
A dashboard can show that engagement dropped.
But the agency’s job is to help explain why.
Fix: Pair important KPI changes with observations and recommended actions.
Social Media KPI Dashboard Best Practices for Agencies
A strong dashboard should make reporting easier, not create another reporting headache.
Follow these practices:
Keep the Most Important KPIs at the Top
The client should understand the headline results within seconds.
Separate KPIs by Goal
Group metrics into awareness, engagement, traffic, leads, and revenue where appropriate.
Show Performance Trends
Don’t show only current numbers.
Show whether performance is moving up, down, or staying flat.
Use Consistent Reporting Periods
Comparing different time periods can create misleading conclusions.
Keep reporting periods consistent.
Customize Dashboards for Each Client
A B2B SaaS client and an ecommerce brand shouldn’t receive identical dashboards.
Their goals are different.
Automate Data Collection Where Possible
The less time your team spends manually copying numbers, the more time they have for strategy and analysis.
Keep the Client’s Business Goals Visible
Every important KPI should have a reason for being there.
If nobody can explain why a metric matters, question whether it belongs on the dashboard.
How a KPI Dashboard Helps Agencies Scale Social Media Reporting
Reporting becomes harder as an agency grows.
One client might need Instagram and Facebook.
Another may need LinkedIn and YouTube.
Another may run paid campaigns across multiple channels.
If every client requires a manually built spreadsheet, reporting time grows with the client base.
A centralized KPI Dashboard can help agencies create a more repeatable reporting process.
Instead of rebuilding every report from scratch, agencies can create dashboard templates for common client types.
For example:
Ecommerce Dashboard
- Revenue
- Purchases
- ROAS
- CPA
- Social traffic
- Conversion rate
B2B Dashboard
- Reach
- Engagement
- Website traffic
- Leads
- Cost per lead
- Conversions
Brand Awareness Dashboard
- Reach
- Impressions
- Video views
- Engagement
- Follower growth
- Mentions
This makes it easier to standardize reporting while still allowing each client dashboard to be customized.
How to Choose a Social Media KPI Dashboard Tool
When an agency evaluates a dashboard platform, the number of integrations shouldn’t be the only consideration.
Look for features that actually improve your reporting workflow.
Integrations
Can the tool connect with the social platforms and other data sources your clients use?
Automation
Can data refresh automatically instead of requiring manual exports?
Custom Metrics
Can you create or calculate the metrics your clients actually care about?
Templates
Can your team reuse dashboard structures across multiple clients?
White-Label Reporting
Can agencies present reports using their own branding when required?
Easy-to-Understand Visuals
Can clients quickly understand the dashboard without extensive explanation?
Scalability
Can the tool handle more clients as your agency grows?
Reporting and Sharing
Can your team easily share dashboards or generate scheduled reports?
The best tool isn’t necessarily the one with the most features.
It’s the one that helps your agency report faster while giving clients clearer answers.
Final Thoughts
A great social media report doesn’t win because it contains the most numbers.
It wins because the client can quickly understand what happened, why it happened, and what should happen next.
That’s the real purpose of a Social Media KPI Dashboard.
Start with the client’s goal.
Choose the metrics that actually measure that goal.
Then organize those metrics into a simple dashboard that makes performance easy to understand.
For agencies, this can mean less time spent collecting and formatting data and more time spent on strategy, optimization, and client growth.
Because at the end of the day, clients don’t hire an agency to give them spreadsheets.
They hire an agency to turn social media activity into results.
And the right KPI Dashboard helps you show exactly how you’re getting there.
Frequently Asked Questions About Social Media KPI Dashboards
What is a Social Media KPI Dashboard?
A Social Media KPI Dashboard is a centralized view of important social media performance metrics. It helps agencies monitor metrics such as reach, engagement, clicks, leads, conversions, and advertising performance in one place.
What KPIs should a social media agency track?
Most agencies should consider tracking reach, impressions, engagement, engagement rate, follower growth, clicks, website traffic, leads, conversions, cost per result, and ROAS. The right KPIs depend on the client’s goals.
How many KPIs should a social media dashboard have?
There is no universal number, but agencies should prioritize a small set of primary KPIs rather than displaying every available metric. Around 5-10 key metrics can provide a useful starting point.
Are followers an important social media KPI?
Follower growth can indicate audience growth, but it should not be treated as the only measure of success. Agencies should connect follower growth with engagement, traffic, leads, conversions, or other relevant business outcomes.
What is the difference between a KPI Dashboard and a social media report?
A KPI Dashboard is generally designed for ongoing performance monitoring, while a social media report often summarizes results for a specific period. Dashboards can help teams spot trends faster and monitor performance between formal reports.
How can agencies save time with a Social Media KPI Dashboard?
Agencies can save time by centralizing data, automating data collection, using reusable templates, and reducing manual spreadsheet work. This allows teams to spend more time analyzing performance and planning strategy.
Should every client have the same KPI Dashboard?
No. Agencies should customize dashboards based on each client’s goals. An ecommerce brand may prioritize revenue and ROAS, while a B2B company may focus more heavily on leads and website conversions.