
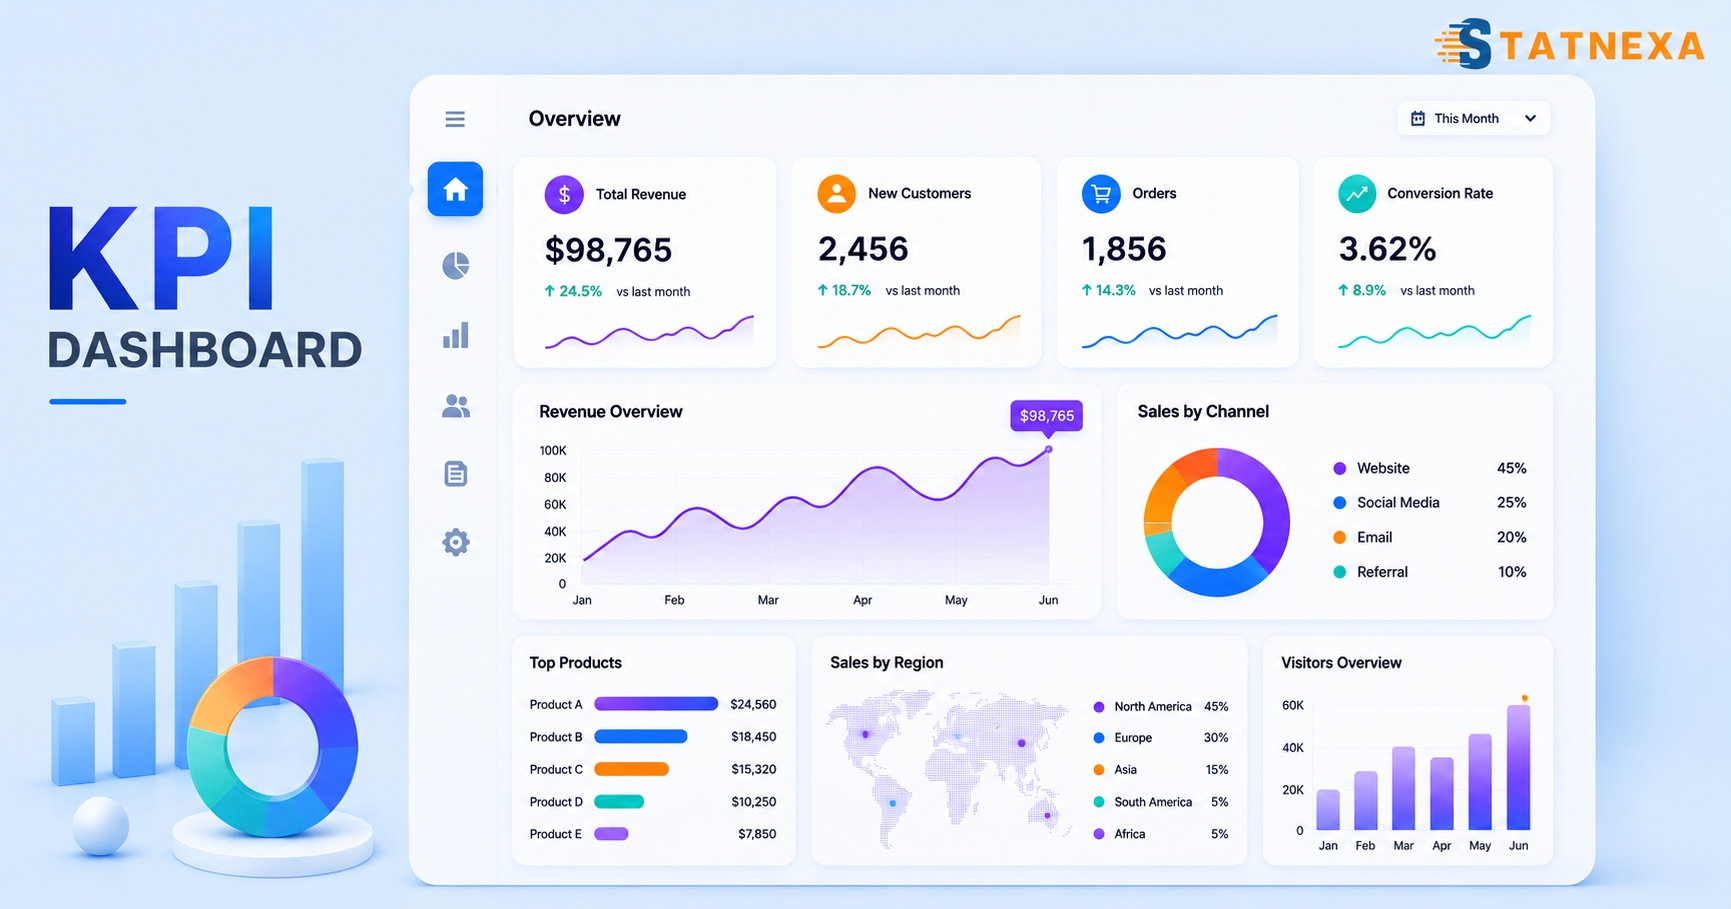
Businesses today generate a huge amount of data every day. From website visitors and sales numbers to marketing campaigns and customer feedback, keeping track of everything can become difficult. Looking at spreadsheets and reports every day is time-consuming, and important insights can easily be missed. This is where a KPI Dashboard becomes valuable.
A KPI Dashboard helps businesses monitor their most important performance metrics in one place. Instead of checking multiple reports, teams can quickly understand what is working, identify areas that need improvement, and make better decisions based on real-time data. Whether you own a small business, manage a marketing team, or lead a large organization, having a clear view of your key performance indicators can improve productivity and business growth.
In this complete guide, you’ll learn what a KPI Dashboard is, how it works, the different types available, and the key benefits it offers. You’ll also discover industry examples, best practices, and tips for choosing the right dashboard software for your business.
KPI dashboards are important for businesses of all sizes. Here are the fundamentals you need to know to get started with kpi dashboard software:
1. What Is a KPI Dashboard?
2. How Does a KPI Dashboard Work?
3. Types of KPI Dashboards
4. Key Benefits of Using a KPI Dashboard
5. KPI Dashboard Examples by Industry
6. Best Practices for Creating an Effective KPI Dashboard
7. How to Choose the Right KPI Dashboard Software
8. Why Businesses Choose StatNexa for KPI Dashboards
9. Conclusion
What Is a KPI Dashboard?
A KPI Dashboard is a visual reporting tool that displays the most important Key Performance Indicators (KPIs) in one easy-to-read screen. It combines data from different sources and presents it using charts, graphs, tables, and scorecards so users can quickly understand business performance.
Instead of searching through multiple reports, businesses can monitor their most important metrics from a single dashboard. This saves time and allows teams to focus on improving performance rather than collecting data.
For example:
- A marketing team can monitor website traffic, conversion rate, ad spend, and lead generation.
- A sales team can track revenue, monthly sales, deal pipeline, and sales targets.
- A customer support team can monitor response time, customer satisfaction, and ticket resolution.
The main purpose of a KPI Dashboard is to turn complex business data into simple visual insights that everyone can understand.
Main Features of a KPI Dashboard
A modern KPI dashboard usually includes:
- Real-time data updates
- Interactive charts and graphs
- Customizable widgets
- Automated reporting
- Goal tracking
- Multi-channel data integration
- Easy sharing with teams
- Mobile-friendly access
These features help businesses monitor performance without spending hours creating manual reports.
How Does a KPI Dashboard Work?
A KPI Dashboard works by collecting data from different business platforms and displaying it in one centralized location. Instead of opening multiple tools every day, users can view all important metrics from a single dashboard.
The process is simple and follows these steps:
1. Data Collection
The dashboard connects with different business tools such as:
- Google Analytics
- Google Ads
- Meta Ads
- LinkedIn Ads
- CRM software
- Email marketing platforms
- Sales software
- Social media accounts
These integrations automatically pull data into the dashboard.
2. Data Processing
After collecting information, the dashboard cleans and organizes the data. It removes duplicates, calculates important metrics, and prepares everything for reporting.
This ensures that decision-makers see accurate and meaningful insights.
3. Data Visualization
The processed information is displayed through visual elements such as:
- Line charts
- Bar graphs
- Pie charts
- Tables
- KPI scorecards
- Progress bars
Visual reports make it much easier to understand performance than large spreadsheets.
4. Performance Monitoring
Users can compare current performance with previous periods, monthly targets, or yearly goals.
For example, a business can instantly see:
- Revenue growth
- Website traffic increase
- Marketing ROI
- Lead generation trends
- Customer acquisition cost
This allows businesses to identify problems before they become serious.
5. Better Decision Making
The biggest advantage of using a KPI Dashboard is faster decision-making.
Instead of waiting for weekly reports, managers can quickly identify declining performance and take immediate action. This helps improve efficiency and keeps teams focused on achieving business goals.
Types of KPI Dashboards
Different businesses have different reporting needs. That’s why KPI dashboards are available in several types, each designed for a specific purpose.
Operational KPI Dashboard
An operational dashboard focuses on daily business activities.
It updates frequently and helps teams monitor real-time operations.
Common metrics include:
- Daily sales
- Website visitors
- Customer support tickets
- Inventory levels
- Production status
These dashboards are useful for managers who need to respond quickly to changes.
Strategic KPI Dashboard
A strategic dashboard helps business leaders monitor long-term goals.
Instead of focusing on daily performance, it tracks overall business growth.
Typical KPIs include:
- Annual revenue
- Profit margin
- Customer retention
- Market share
- Business growth
Executives often use strategic dashboards during monthly or quarterly review meetings.
Analytical KPI Dashboard
An analytical dashboard provides detailed insights into business data.
It helps users identify trends, patterns, and opportunities by analyzing historical information.
Businesses use analytical dashboards for:
- Customer behavior analysis
- Marketing performance
- Sales forecasting
- Financial analysis
- Campaign comparisons
These dashboards support better planning and data-driven strategies.
Tactical KPI Dashboard
A tactical dashboard is designed for department managers.
It tracks team performance against short-term goals.
Examples include:
- Sales team targets
- Marketing campaign performance
- HR recruitment progress
- Project completion status
Managers use tactical dashboards to ensure departments remain on track.
Key Benefits of Using a KPI Dashboard
A well-designed ai seo tools offers more than attractive charts. It helps businesses improve performance, save time, and make smarter decisions.
Here are some of the biggest benefits.
1. Centralized Business Data
Instead of logging into several tools every day, users can view all important metrics from one dashboard.
This saves valuable time and reduces confusion.
2. Real-Time Performance Tracking
Many KPI dashboards update automatically.
Teams always have access to the latest business information, making it easier to respond quickly when performance changes.
For example, if website traffic suddenly drops, marketers can investigate the issue immediately instead of discovering it days later.
3. Better Decision Making
A KPI Dashboard presents information clearly and visually.
Managers no longer rely on assumptions because they have accurate data available whenever they need it.
Better data leads to better business decisions.
4. Increased Team Productivity
Manual reporting often consumes several hours every week.
A KPI dashboard automates data collection and report generation, allowing employees to spend more time on meaningful work instead of preparing spreadsheets.
5. Improved Goal Tracking
Businesses often set monthly or quarterly targets.
A KPI Dashboard makes it easy to compare current performance with these goals.
When targets are missed, teams can quickly identify the reason and make necessary improvements.
6. Easy Collaboration
Modern dashboards can be shared across teams and departments.
Everyone works from the same data, reducing misunderstandings and improving collaboration between marketing, sales, finance, and management.
7. Higher Reporting Accuracy
Manual reports are more likely to contain errors.
Since dashboards automatically collect data from connected platforms, the chances of mistakes are significantly reduced.
This improves confidence in business reporting.
8. Faster Business Growth
Businesses that monitor KPIs regularly can identify opportunities much earlier.
Whether it’s improving customer experience, increasing sales, or reducing costs, timely insights help organizations stay competitive and achieve sustainable growth.
KPI Dashboard Examples by Industry
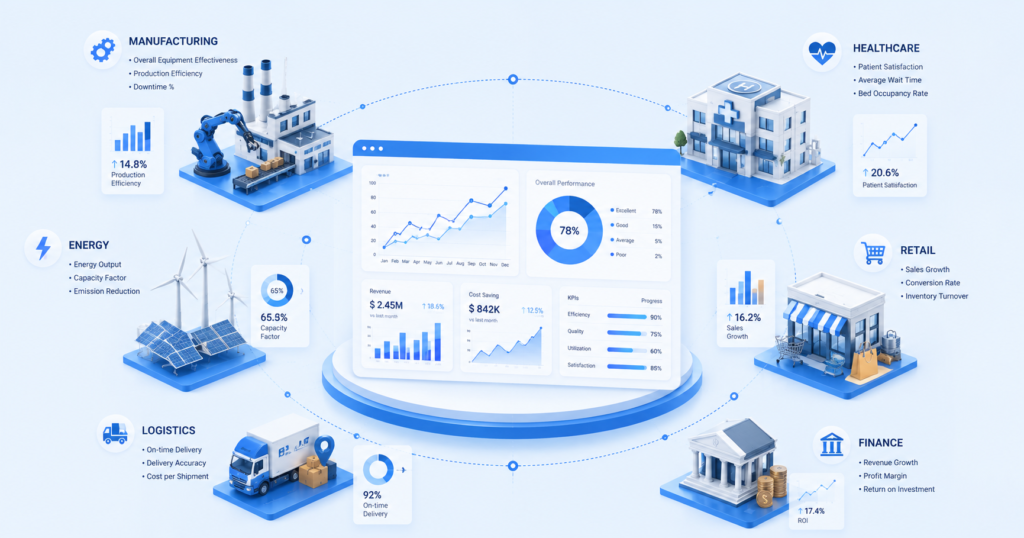
Every industry measures success differently. A ai seo tools can be customized to display the metrics that matter most to a specific business. By showing the right data in one place, teams can monitor performance, identify opportunities, and make better decisions.
Here are some common KPI dashboard examples across different industries.
Marketing KPI Dashboard
Marketing teams run campaigns across multiple channels, making it difficult to track results separately. A marketing KPI dashboard brings all marketing data together in one place.
Some commonly tracked KPIs include:
- Website traffic
- Organic search performance
- Conversion rate
- Cost per lead (CPL)
- Return on ad spend (ROAS)
- Social media engagement
- Email open rate
- Click-through rate (CTR)
With these insights, marketers can understand which campaigns generate the best results and where improvements are needed.
Sales KPI Dashboard
Sales teams need accurate and up-to-date information to meet their revenue goals. A sales dashboard helps managers monitor team performance and identify sales opportunities.
Common sales KPIs include:
- Monthly revenue
- Total deals closed
- Sales pipeline value
- Average deal size
- Lead-to-customer conversion rate
- Sales target achievement
- Customer acquisition cost
This dashboard enables sales leaders to make informed decisions and improve team performance.
Finance KPI Dashboard
Finance departments rely on data to monitor business health and profitability. A finance KPI dashboard simplifies complex financial reports into easy-to-understand visualizations.
Typical financial KPIs include:
- Total revenue
- Net profit
- Operating expenses
- Cash flow
- Gross margin
- Budget vs. actual spending
- Accounts receivable
These metrics help finance teams maintain better control over company finances.
Human Resources KPI Dashboard
HR professionals dashboards to monitor workforce performance and employee satisfaction.
Popular HR KPIs include:
- Employee turnover rate
- Time to hire
- Recruitment cost
- Employee attendance
- Training completion rate
- Employee engagement score
An HR dashboard supports better workforce planning and improves employee management.
Customer Support KPI Dashboard
Customer service plays a major role in customer retention. A support dashboard helps teams monitor service quality and respond faster to customer needs.
Important KPIs include:
- First response time
- Average resolution time
- Customer satisfaction score (CSAT)
- Number of support tickets
- Ticket backlog
- Customer retention rate
Tracking these metrics helps businesses deliver a better customer experience.
Best Practices for Creating an Effective KPI Dashboard
Creating a dashboard is not just about adding charts and graphs. An effective KPI Dashboard should be simple, relevant, and easy to understand. Following these best practices can help businesses get the most value from their dashboards.
Define Clear Business Goals
Before building a dashboard, identify the objectives you want to achieve. Every KPI should support a specific business goal.
For example, if your goal is to increase sales, focus on revenue, conversion rate, and lead generation instead of tracking unnecessary metrics.
Track Only Important KPIs
Including too many metrics can make a dashboard confusing. Select only the KPIs that directly impact your business performance.
A clean dashboard helps users quickly understand the information without feeling overwhelmed.
Keep the Design Simple
A well-organized dashboard improves readability. Use clear headings, logical sections, and appropriate charts to present information.
Avoid cluttered layouts or excessive visual elements that distract users from the important data.
Use Real-Time Data
Business conditions can change quickly. A dashboard that updates automatically allows teams to react faster and make timely decisions.
Real-time reporting using seo report template also reduces the need for manual updates.
Choose the Right Visualizations
Different charts serve different purposes.
For example:
- Line charts show trends over time.
- Bar charts compare values.
- Pie charts display proportions.
- Scorecards highlight important KPIs.
Using the right visualization makes reports easier to understand.
Review and Update Regularly
Business priorities change over time. Review your dashboard regularly to ensure it continues to display the most relevant KPIs.
Removing outdated metrics keeps the dashboard useful and focused, In this article understand how it works.
How to Choose the Right KPI Dashboard Software

With many dashboard solutions available, choosing the right one can be challenging. The ideal software should match your business size, reporting needs, and future growth plans.
Here are some important factors to consider.
Easy-to-Use Interface
The software should have a user-friendly interface so both technical and non-technical users can create and understand reports without extensive training.
Multiple Data Integrations
Choose software that connects with the platforms your business already uses, such as:
- Google Analytics
- Google Ads
- Meta Ads
- LinkedIn Ads
- CRM systems
- Excel
- Email marketing platforms
The more integrations available, the easier it becomes to centralize your business data.
Real-Time Reporting
Real-time data ensures your dashboard always reflects the latest business performance. This enables faster decision-making and quicker responses to changing trends.
Customizable Dashboards
Every business has unique reporting requirements. Good dashboard software should allow users to customize layouts, widgets, charts, and KPIs based on their specific needs.
Automated Reporting
Automated reports save valuable time by eliminating repetitive manual work. Look for software that can schedule daily, weekly, or monthly reports.
Business data is valuable. Ensure the platform provides secure data storage, user access controls, and reliable backup options to protect sensitive information.
Data Security
Business data is valuable. Ensure the platform provides secure data storage, user access controls, and reliable backup options to protect sensitive information.
Scalability
As your business grows, your reporting needs will also expand. Choose software that can handle increasing amounts of data and support additional users without affecting performance.
Why Businesses Choose StatNexa for KPI Dashboards
Businesses need more than just reports-they need clear insights that support faster and smarter decisions. That’s why many organizations choose StatNexa as their KPI dashboard solution and availabe seo report software, agency based template.
StatNexa is designed to simplify business reporting by bringing data from multiple marketing, sales, and analytics platforms into one centralized dashboard. Instead of switching between different tools, users can monitor all their important KPIs from a single interface.
Some of the key features that make StatNexa a preferred choice include:
- Real-time KPI monitoring
- Easy-to-read dashboards
- Multiple data source integrations
- Automated reporting
- Custom dashboard creation
- Secure data management
- Team collaboration features
- Interactive charts and visual reports
Whether you’re a startup, marketing agency, eCommerce business, or growing enterprise, StatNexa helps transform raw data into meaningful insights that support better business decisions.
With automated reporting and customizable dashboards, businesses can spend less time preparing reports and more time improving performance.
Conclusion
A KPI Dashboard has become an essential business tool for organizations that want to make smarter, data-driven decisions. By collecting information from multiple sources and presenting it through easy-to-understand visual reports, dashboards help businesses monitor performance, improve productivity, and achieve their goals more efficiently.
Whether you’re managing marketing campaigns, tracking sales performance, monitoring financial health, or measuring customer satisfaction, the right KPI dashboard provides the visibility needed to stay ahead of the competition.
When selecting dashboard software, focus on ease of use, seo tracking, data integrations, customization, and scalability. These features ensure your reporting system continues to support your business as it grows.
If you’re looking for a powerful yet easy-to-use KPI dashboard solution, StatNexa offers everything you need to centralize your data, automate reporting, and gain actionable insights from one intuitive platform. By making data accessible and meaningful, StatNexa empowers businesses to make confident decisions and drive long-term success.
Frequently Asked Questions (FAQs)
1. What is a KPI Dashboard?
A KPI Dashboard is a visual reporting tool that displays key performance indicators (KPIs) in one place. It helps businesses track performance, monitor progress, and make informed decisions using real-time data, charts, and graphs.
2. What is the purpose of a KPI Dashboard?
The main purpose of a KPI Dashboard is to provide a clear view of business performance. It allows teams to monitor important metrics, identify trends, measure progress toward goals, and make faster, data-driven decisions.
3. What are the different types of KPI Dashboards?
The four main types of KPI Dashboards are:
- Operational KPI Dashboard
- Strategic KPI Dashboard
- Tactical KPI Dashboard
- Analytical KPI Dashboard
Each type is designed to meet different reporting and business needs.
4. What metrics should be included in a KPI Dashboard?
The metrics depend on your business goals. Common KPIs include revenue, sales growth, website traffic, conversion rate, customer acquisition cost (CAC), customer retention rate, return on investment (ROI), and customer satisfaction score (CSAT).
5. Which industries use KPI Dashboards?
KPI Dashboards are widely used across industries, including marketing, sales, finance, healthcare, retail, manufacturing, education, human resources, customer support, and eCommerce.
6. Why should businesses use StatNexa for KPI Dashboards?
StatNexa helps businesses monitor key performance metrics from multiple data sources in one centralized dashboard. It offers real-time reporting, customizable dashboards, automated reports, and interactive visualizations to simplify business performance tracking.