
Turn Azure SQL Data into AI-Powered Business Intelligence
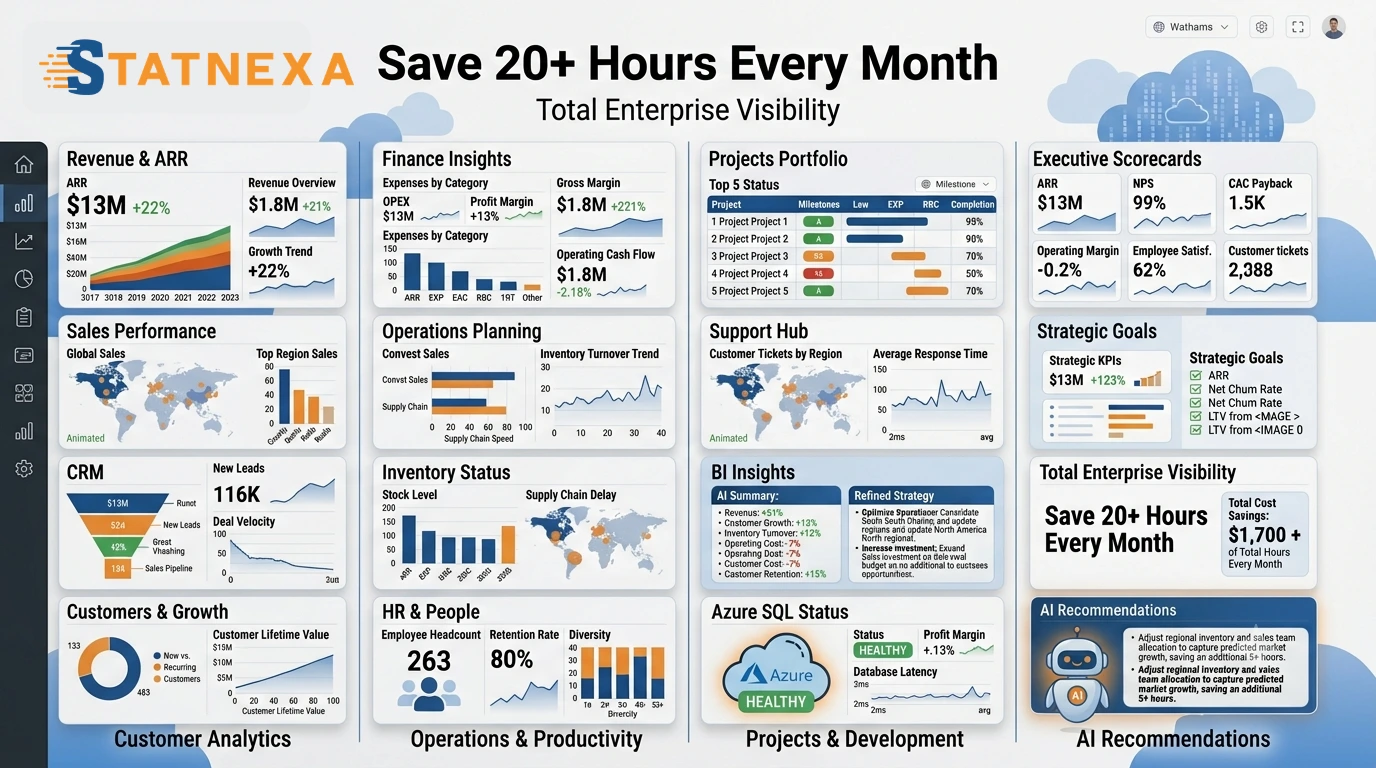
One Cloud Database. Complete Business Visibility.
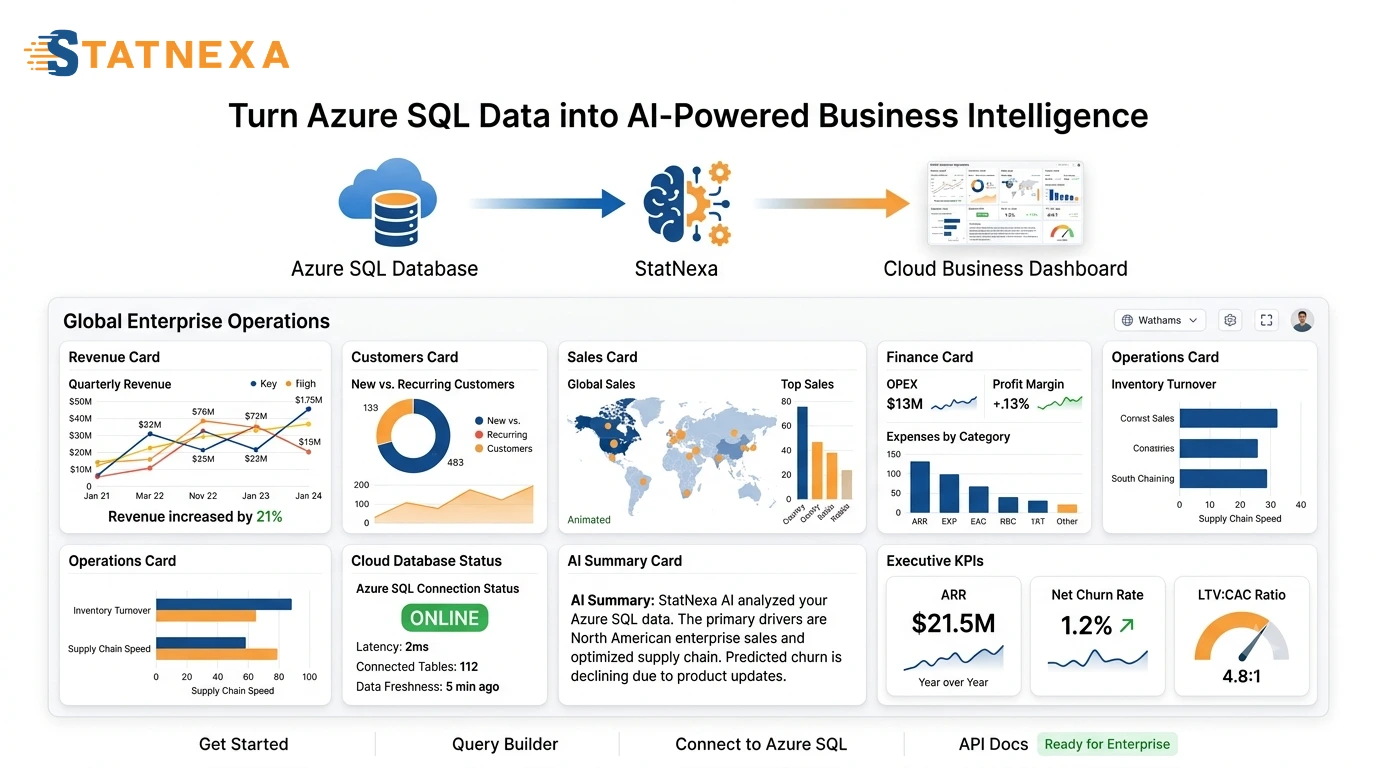
Azure SQL powers cloud-native applications across finance, ecommerce, SaaS, CRM, ERP, and operations.
StatNexa connects directly to Azure SQL and automatically transforms cloud database records into interactive dashboards, AI-generated reports, and executive-ready insights. Instead of manually exporting cloud data, your teams gain real-time visibility into business performance and make faster, data-driven decisions.
Everything You Need to Transform Azure SQL Data into Actionable Intelligence
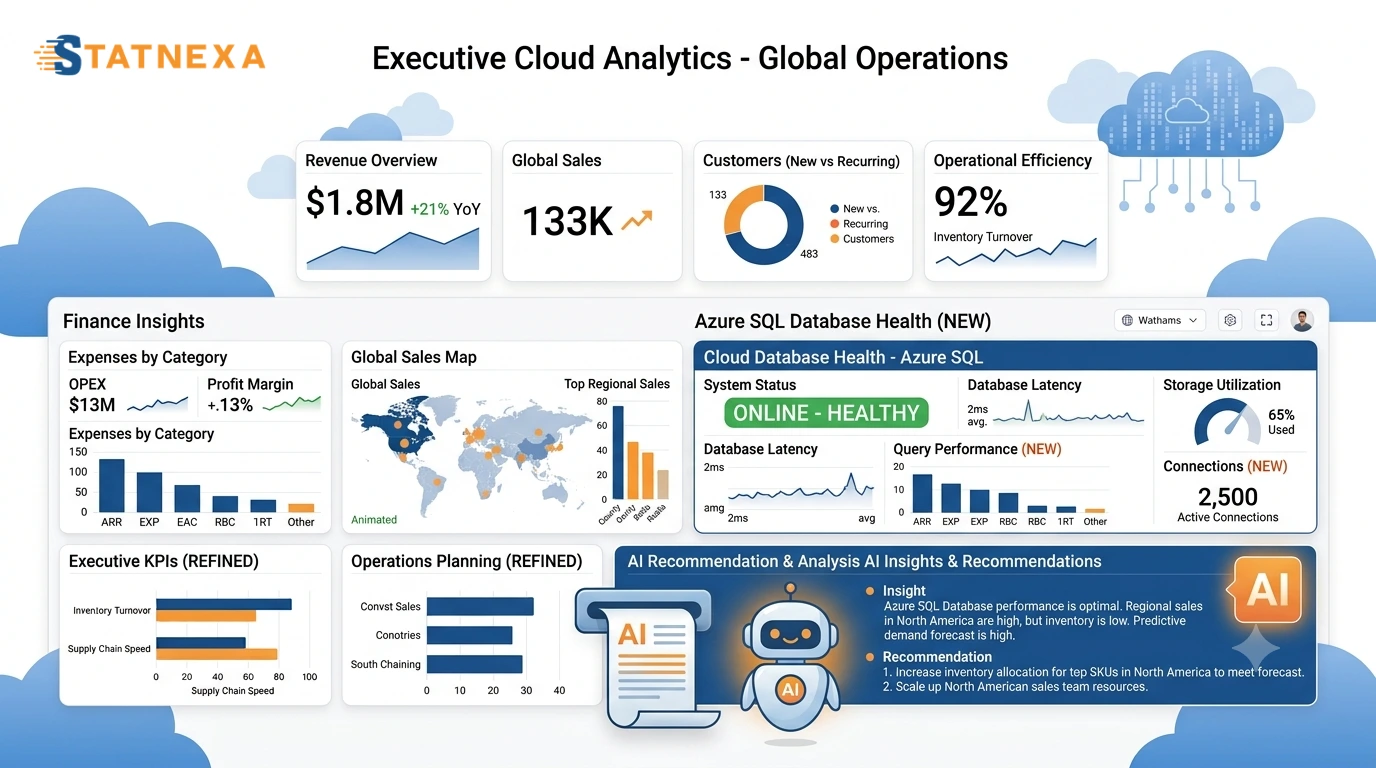
StatNexa combines Azure SQL connectivity, automation, AI-powered reporting, and interactive dashboards into one intelligent reporting platform.
Monitor cloud database metrics, identify business trends, generate executive summaries, and deliver client-ready reports without manually exporting data.
Meet Your AI Reporting Assistant
Imagine opening your dashboard every morning and instantly understanding what's happening across your Azure SQL environment.Instead of manually reviewing cloud database reports, StatNexa continuously analyzes your business data and highlights the insights that matter most.
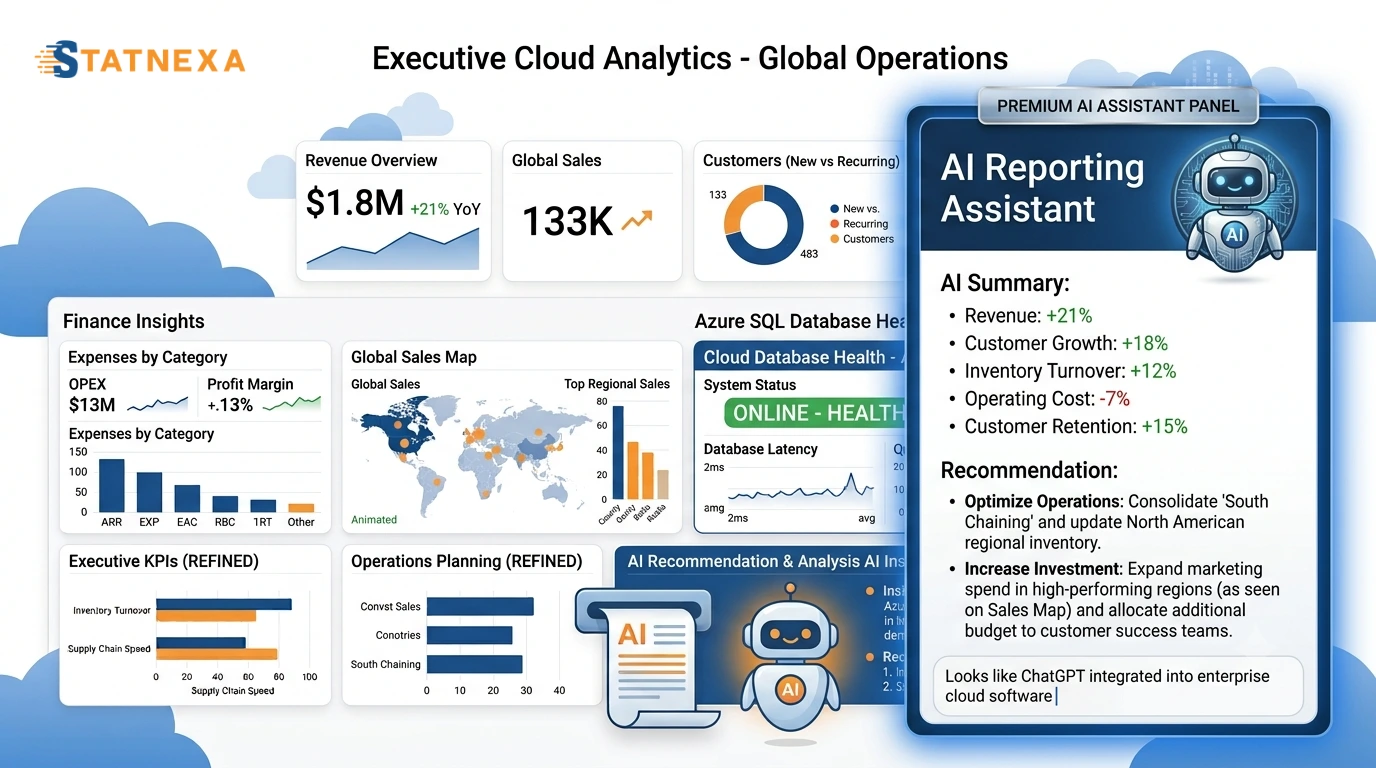
AI Business Insights
- 📈 Revenue increased by 21%
- 👥 Customer growth increased by 18%
- 📦 Inventory turnover improved by 12%
- 💰 Operating costs reduced by 7%
- ⭐ Customer retention increased by 15%
AI Recommendation
Increase investment in your highest-performing business units while optimizing underperforming operational processes.
Experience AI-Powered ReportingReplace Manual Cloud Reporting with AI Automation
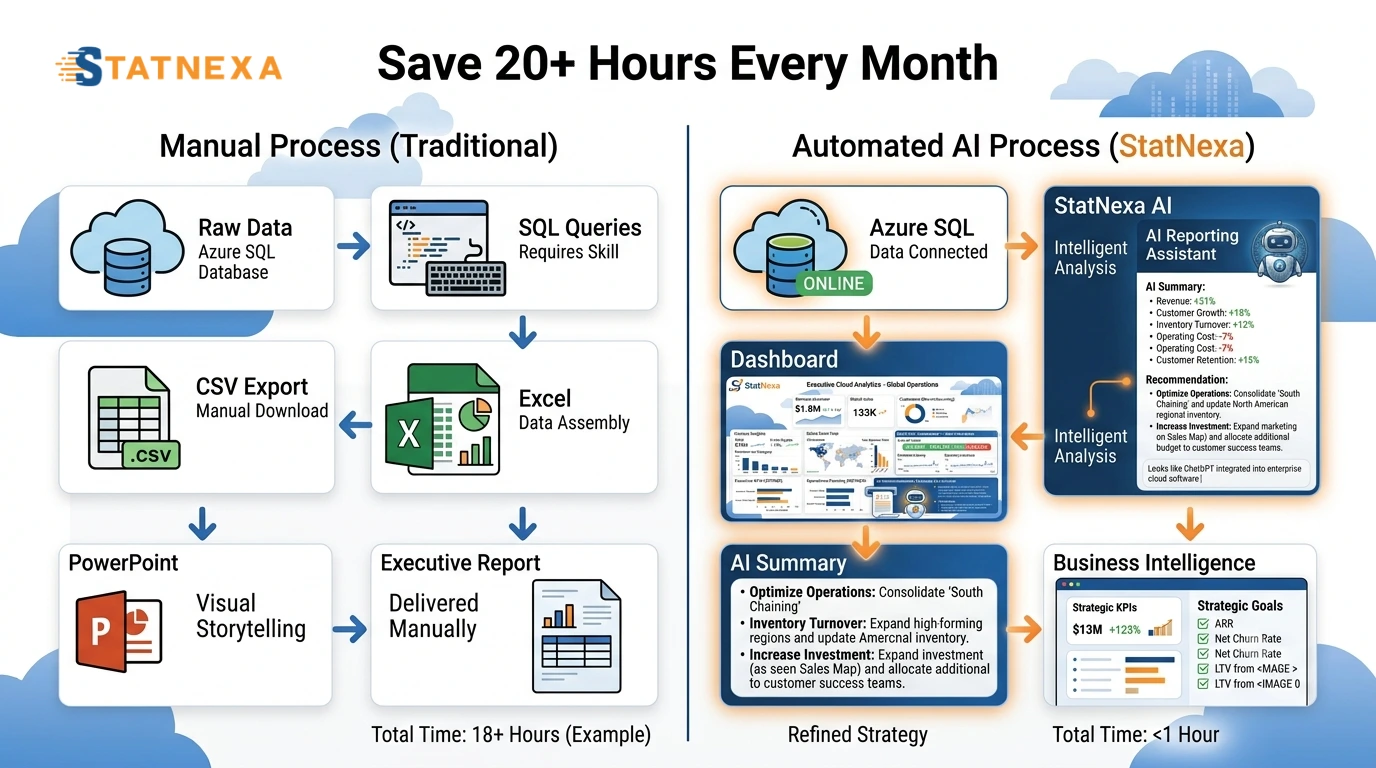
Traditional Azure SQL reporting often requires SQL queries, cloud exports, spreadsheets, and manual report creation.
StatNexa automates the reporting workflow, helping your team spend less time preparing reports and more time making strategic business decisions.
Build Dashboards for Every Business Department
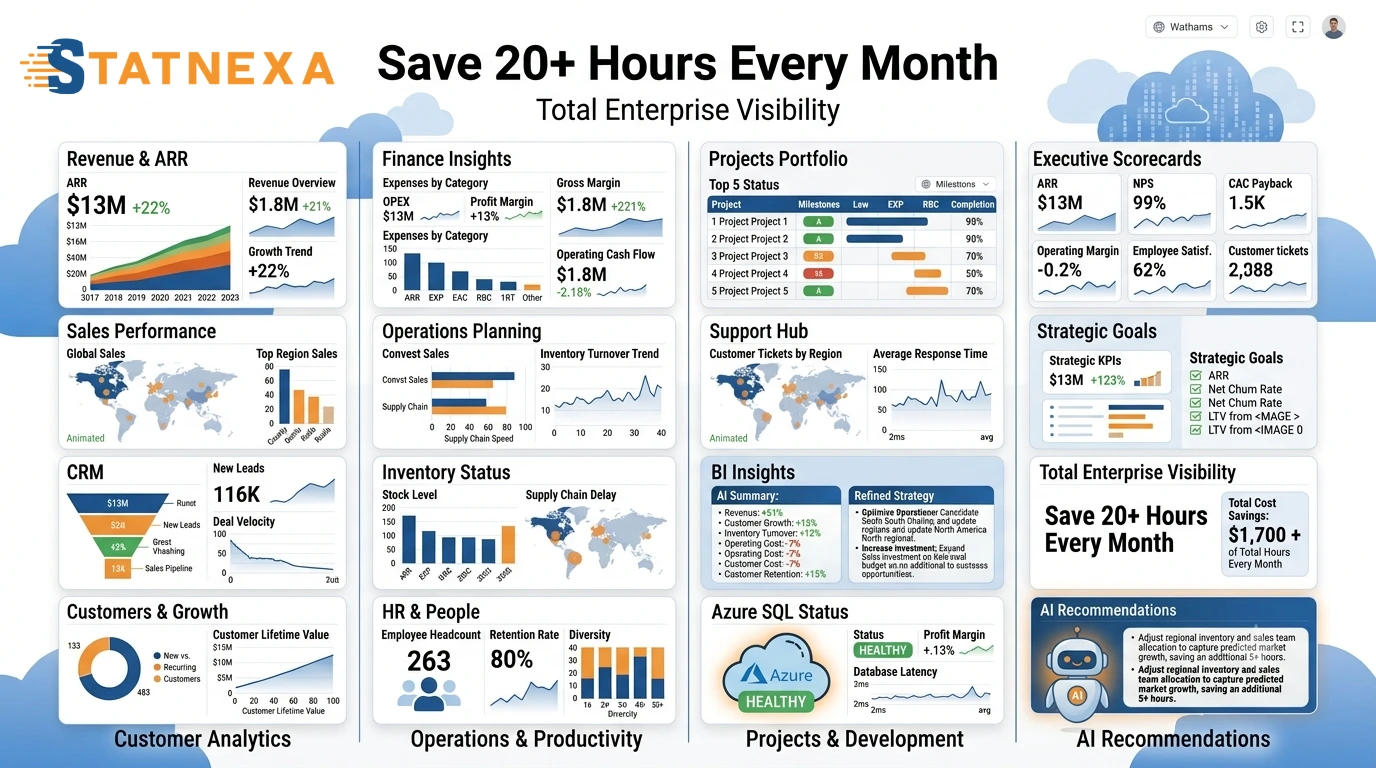
Transform Azure SQL data into interactive dashboards for every business function.
Monitor finance, sales, customers, inventory, HR, CRM, operations, executive KPIs, and custom business metrics from one centralized reporting platform.
Ready to Turn Azure SQL Data into Business Intelligence?
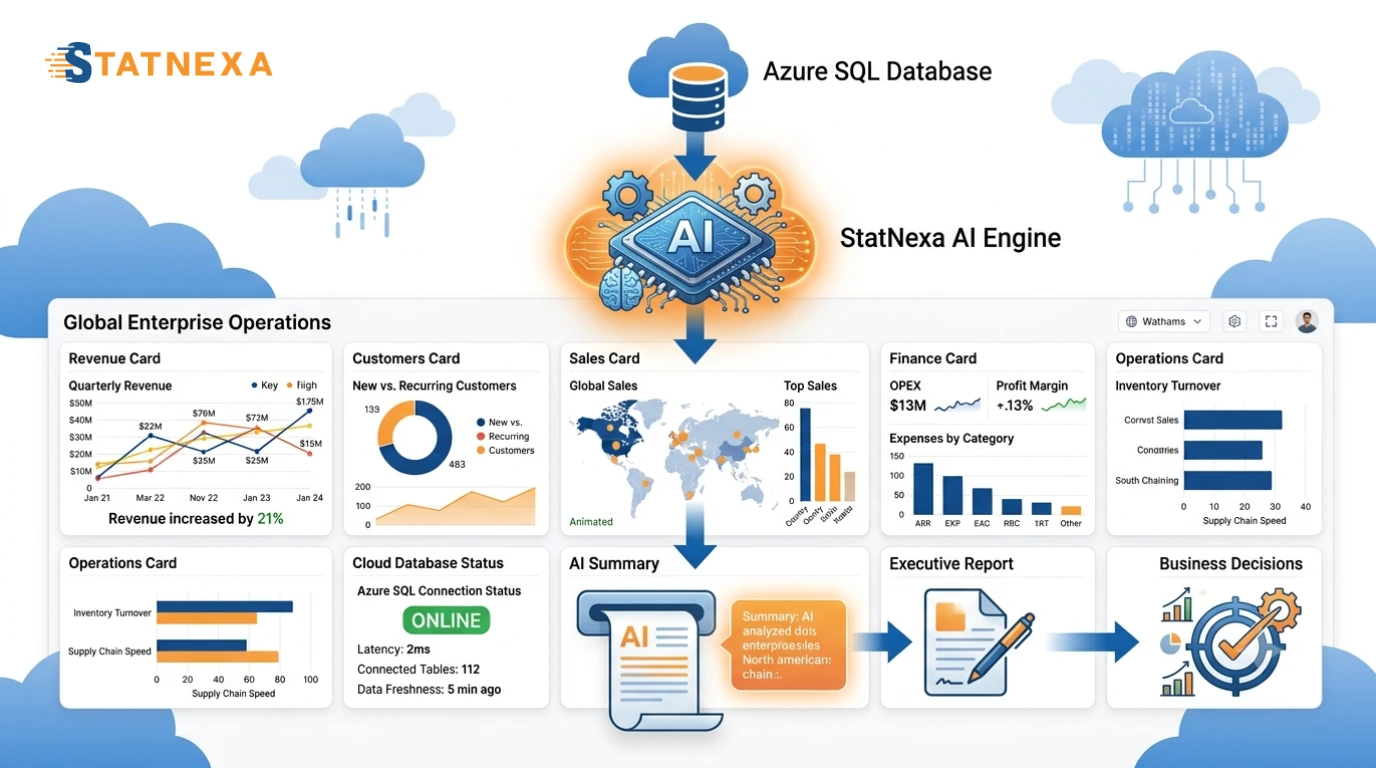
Stop exporting cloud database data manually.
Connect Azure SQL once and let StatNexa automatically generate AI-powered reports, dashboards with AI Insights, and executive business intelligence that helps your organization make faster, smarter decisions.
If your question is not answered here,
please Contact Us directly!
How can Azure SQL data be used for business intelligence?
StatNexa turns Azure SQL tables and query results into visual dashboards for tracking important business metrics. Teams can analyze operational, sales, customer, and other business data in one reporting environment.
What Azure SQL metrics can I track with StatNexa?
You can define metrics and dimensions from your Azure SQL tables or views based on the data you need to analyze. This allows dashboards to focus on KPIs such as sales, transactions, customers, revenue, and operational performance.
Can I use custom T-SQL queries for Azure SQL reporting?
Yes. StatNexa supports custom T-SQL queries to join tables, aggregate data, and select specific fields for reporting. This gives teams greater control over the metrics and dimensions displayed in dashboards.
How does Azure SQL reporting simplify data analysis?
StatNexa converts complex Azure SQL data into centralized visual dashboards, reducing the need to work directly with raw database tables. Teams can monitor key trends and business KPIs from a single reporting interface.
Can Azure SQL data be combined with other business data?
Yes. Azure SQL data can be blended with marketing, sales, analytics, CRM, and advertising data for cross-source analysis. This helps businesses connect database performance with broader business and marketing KPIs.
Can I create a custom Azure SQL dashboard?
Yes. You can select Azure SQL databases, tables or views, then define the required metrics and dimensions for your dashboard. StatNexa lets you customize reporting around the KPIs most important to your business.
 Contact Us