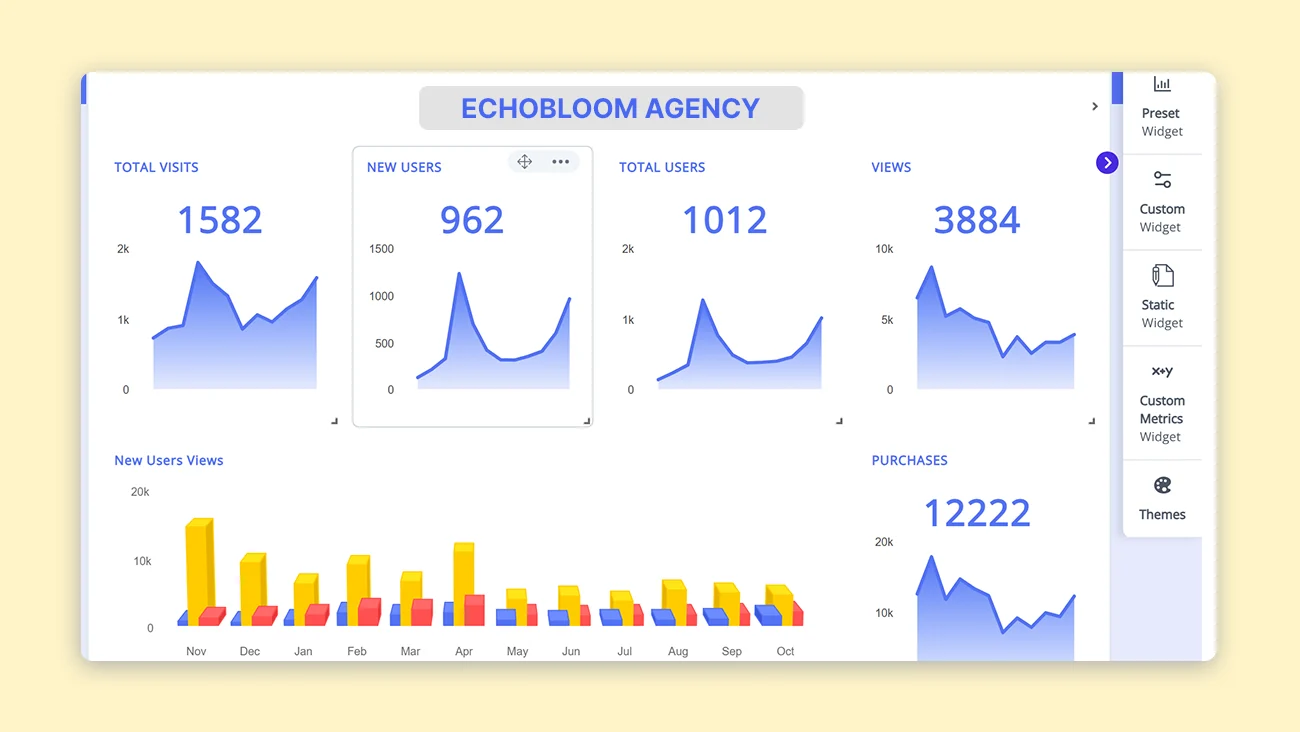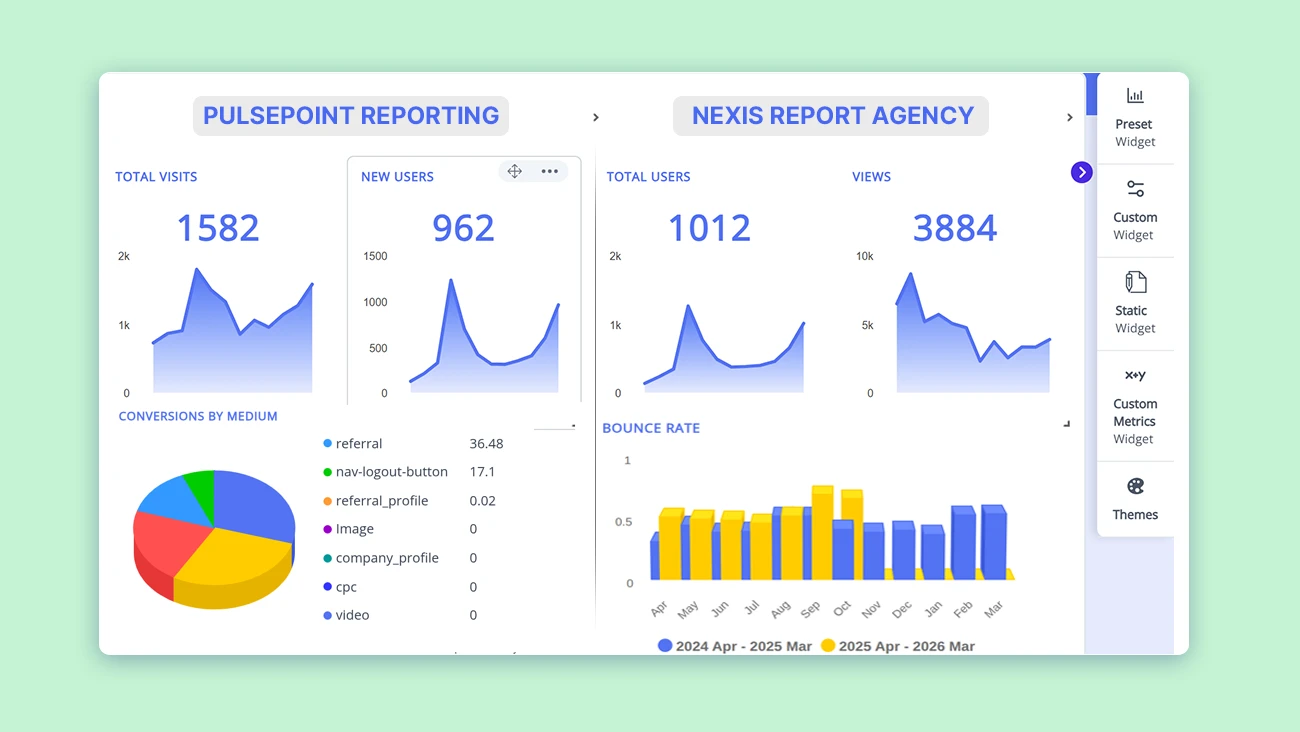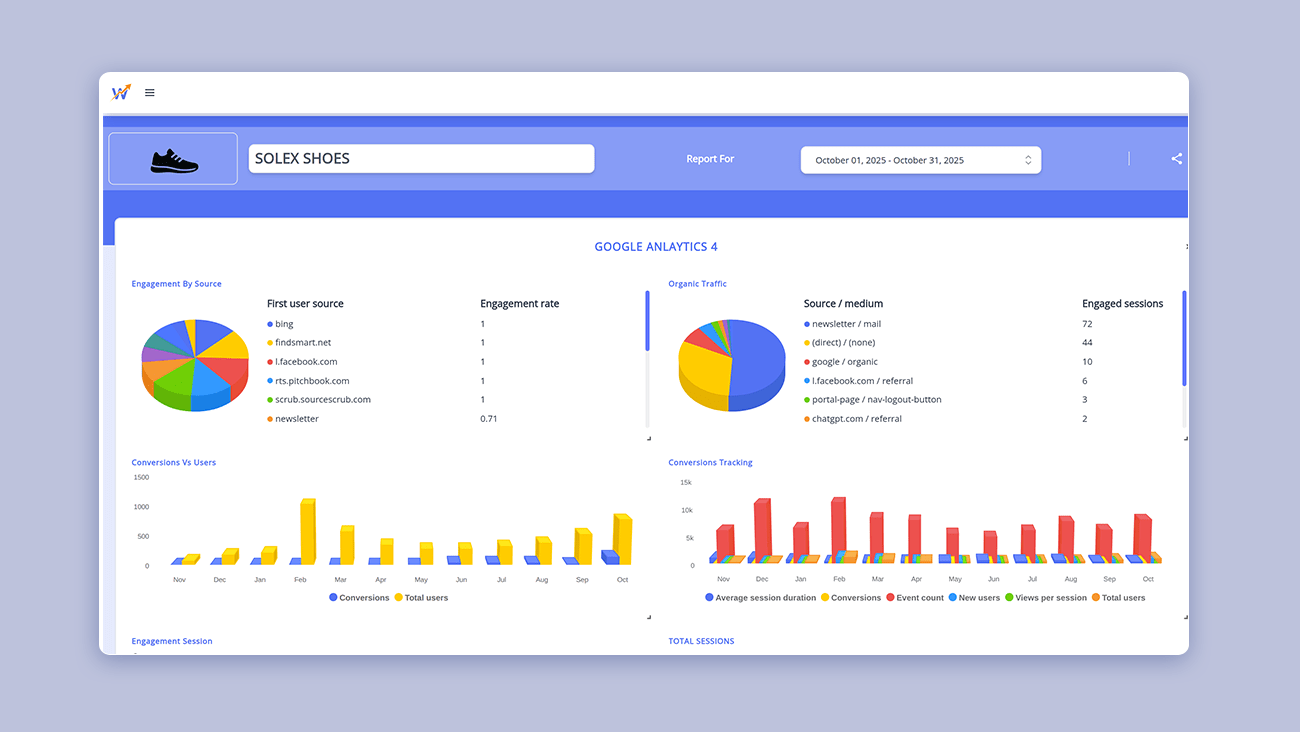
Eliminate manual data merges and endless spreadsheets. Multi-Client Reports & Dashboards automatically combine insights from multiple clients, brands, or regions into one powerful overview. Compare, analyse, and showcase your agency’s total performance—all from a single, intuitive interface.
Bring all your clients, brands, and locations together in one view. Instantly aggregate key metrics into powerful, shareable dashboards that tell the full story.
Spot performance trends across business types and regions to shape data-driven strategies that boost results.
Compare campaigns, clients, or locations side by side to spot trends, uncover inefficiencies, and drive actionable insights for better results.
See the big picture for your agency with dashboards and reports that aggregate metrics across your full client roster. Make data-driven decisions faster and more effectively.
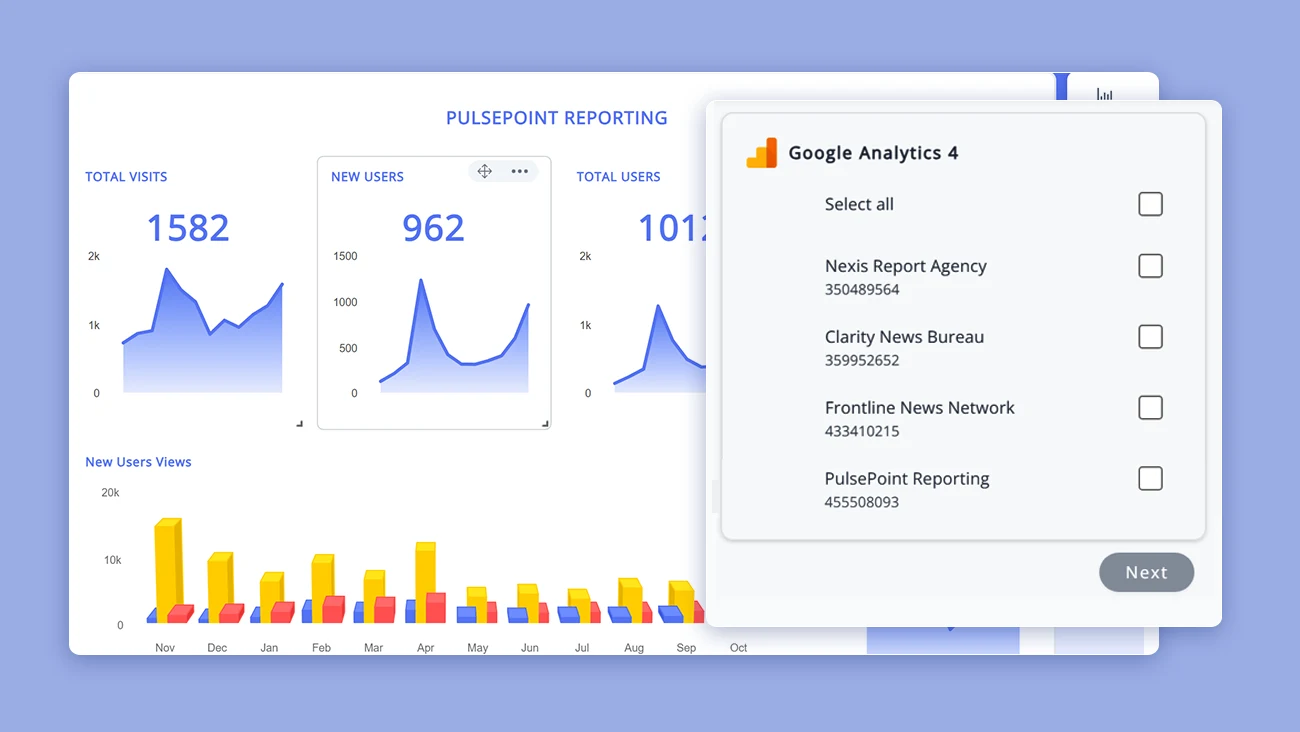
No more jumping between accounts or manually compiling spreadsheets. Multi-Client Dashboards bring together all your campaign data—spend, conversions, engagement, and more—into one powerful view. Get instant clarity on overall performance across clients, brands, or regions.
Consolidate performance data from multiple clients or locations with Multi-Client Reports & Dashboards. Easily spot what’s working, where improvement is needed, and which initiatives deserve focus—empowering actionable insights across your agency.
Bring multiple clients, locations, or franchises into one dashboard for a comprehensive comparison. Instantly spot trends, outliers, and performance differences to communicate value clearly and identify opportunities for growth.
Avoid errors and inefficiencies caused by manual reporting. Multi-Client Dashboards fetch data directly from your connected platforms, ensuring precise, consistent, and timely insights. Focus on creating impact while clients receive accurate, actionable reporting.
Bring together performance data from 90+ platforms into a single dashboard. Integrate Google Analytics, Google Ads, Facebook, LinkedIn, and Search Console to see every client campaign clearly—without the tedious manual data pulls.
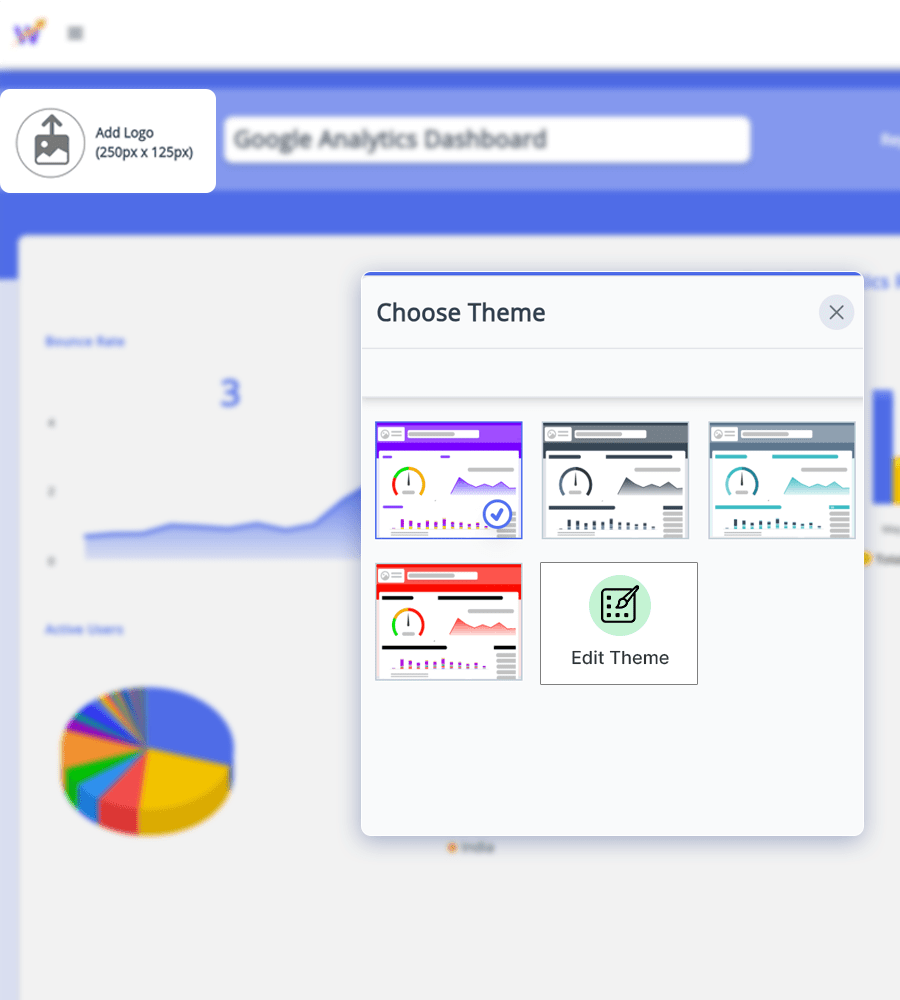
Showcase your agency’s identity with white-labeled ... dashboards and reports. Incorporate logos, colour schemes, and your domain to deliver professional, consistent, and client-focused insights. More
Highlight your clients’ progress with integrated goal ... tracking. Map key metrics visually in dashboards and reports, providing immediate insight into how your campaigns are driving results. More
Multi-client reporting brings performance data from multiple clients, accounts, brands, locations, or campaigns into a centralized reporting environment. Instead of reviewing each account separately, agencies can monitor important KPIs across their entire client portfolio, compare performance, identify trends, and make faster data-driven decisions from one place.
StatNexa centralizes data from multiple clients and marketing platforms into unified dashboards and reports. Agencies can track metrics such as campaign spend, conversions, engagement, traffic, and other KPIs without manually combining spreadsheets or switching between accounts. This makes it easier to monitor overall agency performance and identify accounts that need attention.
Yes. StatNexa's multi-client dashboards let you compare clients, campaigns, brands, locations, or franchises within a single view. This makes it easier to identify performance differences, trends, outliers, and opportunities across accounts. Agencies can use these comparisons to benchmark results and determine which strategies or campaigns are performing most effectively.
Yes. StatNexa supports 90+ data integrations, allowing agencies to consolidate client data from platforms such as Google Analytics, Google Ads, Facebook Ads, LinkedIn, Google Search Console, and other marketing and business platforms. This creates a centralized view of multi-channel performance without requiring teams to manually collect data from individual platforms.
Multi-client reporting gives agencies a portfolio-level view of performance as their client base grows. Teams can quickly identify high-performing accounts, underperforming campaigns, recurring trends, and areas requiring attention. By reducing repetitive data collection and providing centralized performance visibility, agencies can spend less time preparing reports and more time optimizing client strategies.
Yes. StatNexa allows agencies to create customized dashboards and reports using flexible reporting tools while maintaining consistent agency branding. Reports can focus on the KPIs most relevant to each client and incorporate branding elements such as logos, colours, and domains, helping agencies deliver a professional and consistent reporting experience.
Yes. Agencies can provide clients with access to relevant dashboards and reports while controlling what information they can see. This gives clients convenient access to performance insights while allowing the agency to maintain control over reporting permissions and presentation. Reports and dashboards can also be shared through appropriate sharing options.
Spreadsheets often require teams to manually export, merge, update, and verify data from multiple client accounts. StatNexa connects directly with supported data sources and brings client performance into centralized dashboards and reports. This reduces repetitive reporting work, improves consistency, and makes it easier to compare performance across clients, campaigns, brands, or locations.