
Turn Google Analytics 4 Data into AI-Powered Client Insights
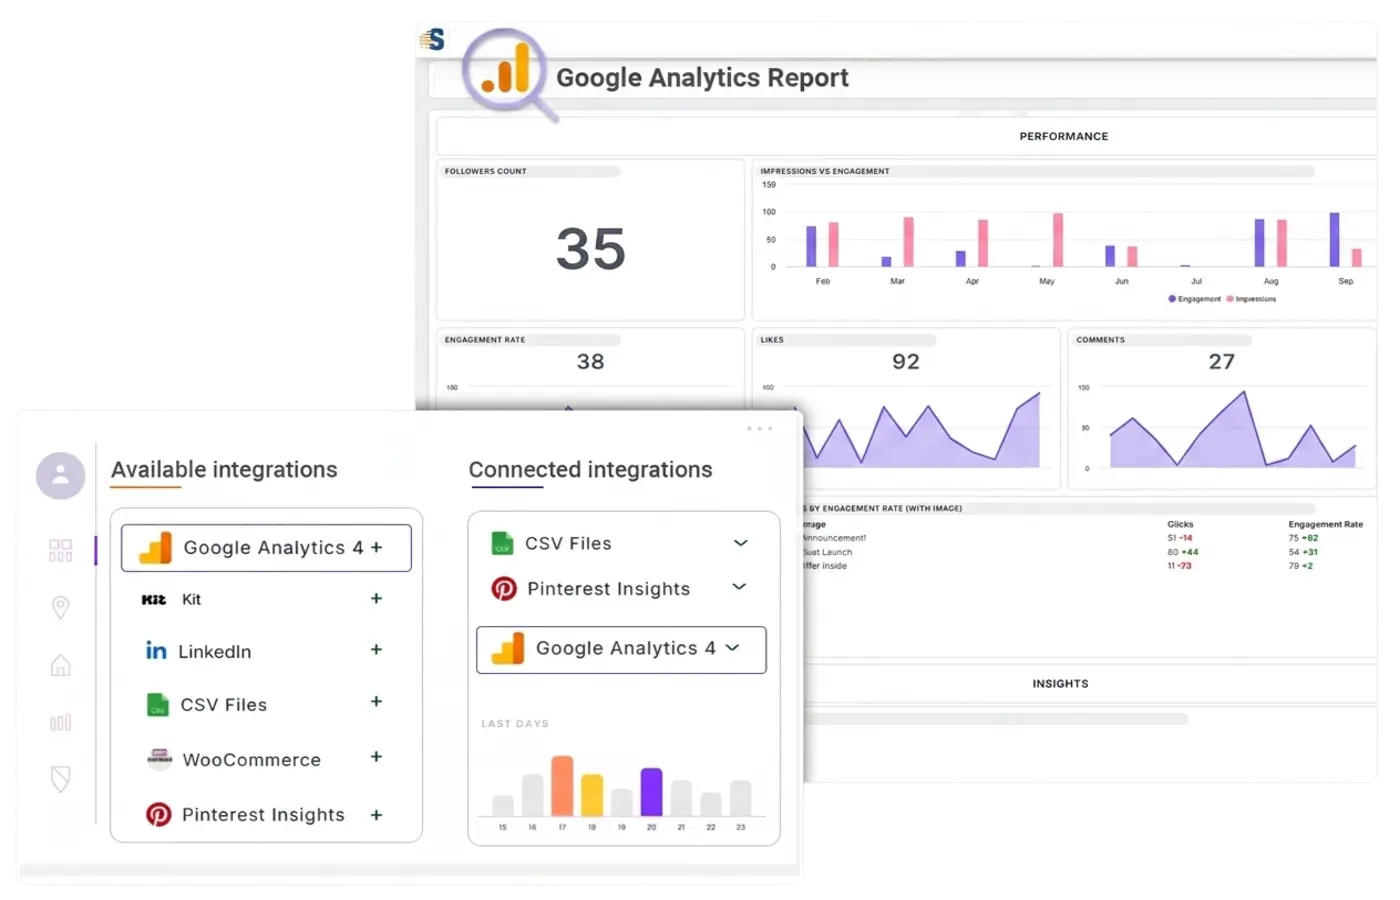
Everything You Need to Transform GA4 Data into Actionable Intelligence

AI-Powered Reporting
Automatically transform GA4 metrics into executive-ready reports with AI-generated summaries, intelligent recommendations, and automated reporting workflows.
Dashboard with AI Insights
Move beyond charts and graphs. Detect traffic anomalies, identify conversion opportunities, and understand why performance changed with built-in AI Insights.
Client-ready Insights
Convert complex website analytics into clear business insights that help clients understand campaign performance and make confident decisions.
White-label Reporting
Deliver beautifully branded dashboards, reports, and client portals with your agency's logo, colors, and identity.
Save 20+ Hours Every Month
Deliver beautifully branded dashboards, reports, and client portals with your agency's logo, colors, and identity.
Marketing Intelligence
Automate recurring reports, eliminate manual exports, and spend more time optimizing campaigns instead of building presentations.
Pre-Built Template View
You can now explore and preview pre-built templates before applying them. Instantly streamline your StatNexa automation with ready-to-use workflows—no coding required. Just preview, select, and deploy in a click!
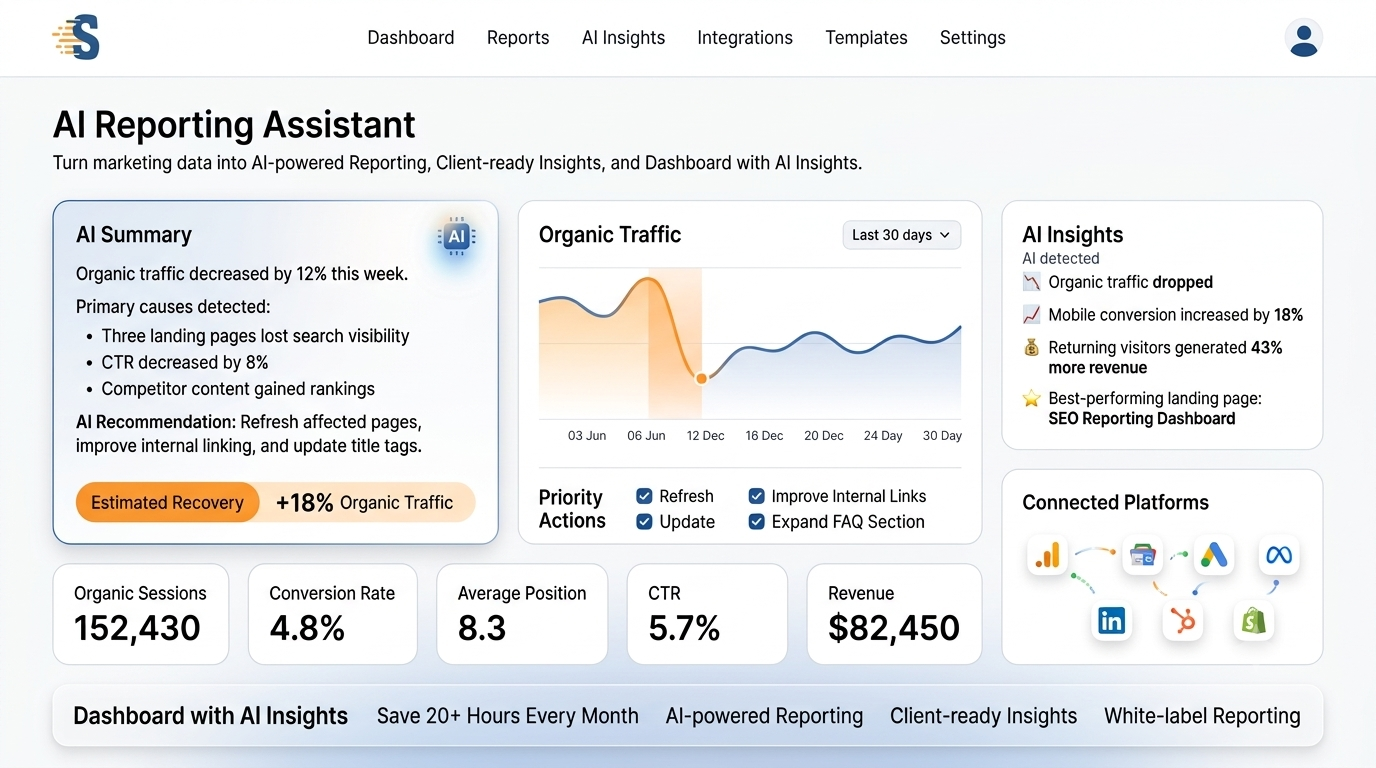
Meet Your AI Reporting Assistant
Imagine opening your dashboard every morning and instantly understanding what matters most.
Instead of manually reviewing reports, StatNexa continuously analyzes your connected analytics data and highlights the insights that need your attention.
AI Insights Example
Organic traffic dropped because three landing pages lost search visibility.
Mobile conversion rate increased by 18% after your latest landing page update.
Returning visitors generated 43% more revenue this month.
AI recommends refreshing your pricing page to improve conversion rates.
 Contact Us