
LinkedIn: Top Professional Network
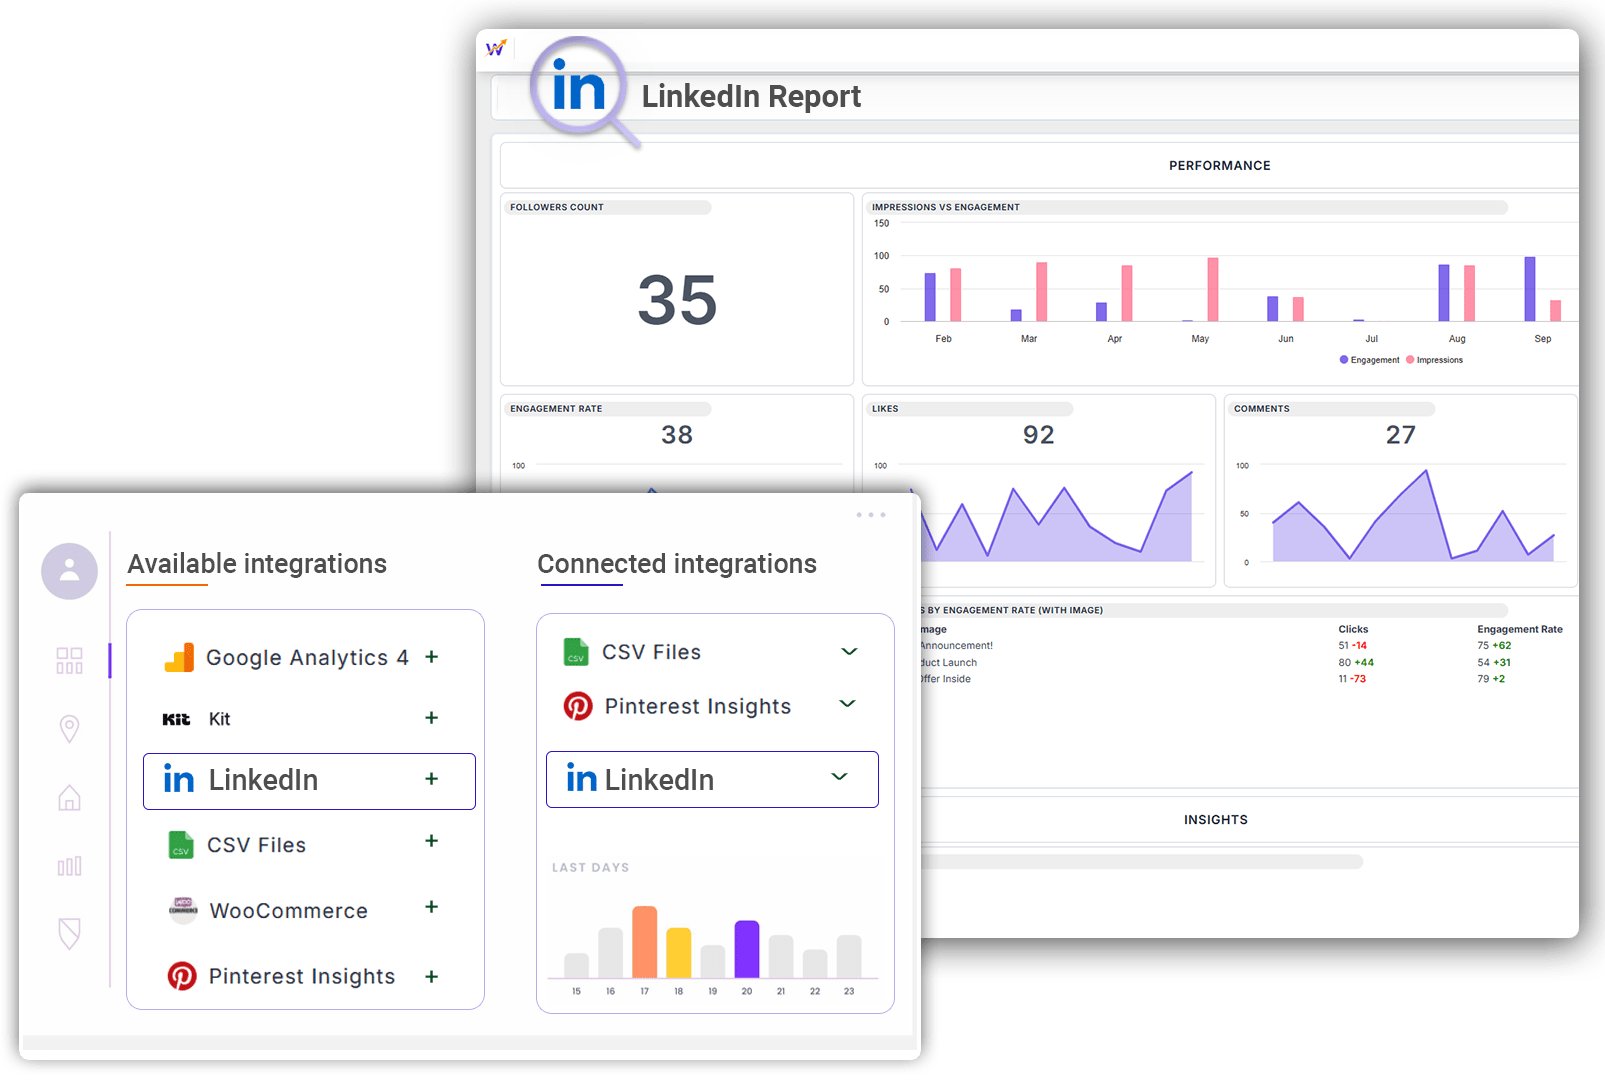
Key features to use LinkedIn on StatNexa

Track Long-Term Revenue Impact
Analyze Customer Segment Performance
Compare Marketing Channel Effectiveness
Design Your Custom Dashboard
Import Historical Campaign Data
Automate Client Reporting
Get Instant Marketing Insights
Unified Marketing Performance Metrics
Pre-Built Template View
You can now explore and preview pre-built templates before applying them. Instantly streamline your StatNexa automation with ready-to-use workflows—no coding required. Just preview, select, and deploy in a click!
Integrating LinkedIn with StatNexa
LinkedIn is a powerful platform for networking, brand visibility, and professional growth. It enables businesses and individuals to showcase expertise, connect with key industry players, and generate high-quality leads.
By integrating LinkedIn with StatNexa, you can streamline your outreach, track engagement, and optimize your marketing strategy. Gain valuable insights into your LinkedIn performance, refine your targeting, and drive meaningful business growth.
How to connect LinkedIn account with StatNexa

All the Metrics and Dimensions you need for LinkedIn
Dimensions
Metrics
StatNexa is your all-in-one marketing analytics solution.
The easiest way to grow your business? Scale what works and ditch what doesn’t. Custom Segments help you identify what’s effective—whether it's emails, lead magnets, webinars, and more—to boost your marketing.
Explore Our Ready-Made Widgets:
Effortless Solutions at Your Fingertips
Improve efficiency with widgets preloaded with key KPIs. Just drag and drop and you're done, turning data tracking into a seamless experience. Easily extend your analysis.
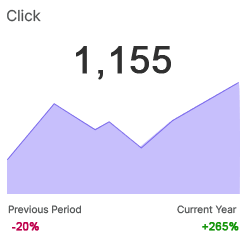
Clicks
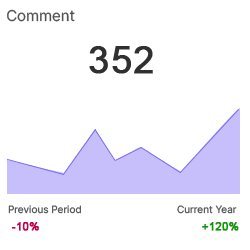
Comments
Available Metrics, Segments, & Dimensions
Users typically incorporate specific metrics and dimensions when compiling reports for their LinkedIn analytics.
Engagement
Impressions
Likes
Shares
Follower Engagement Rate
Engaged Viewers
Time Watched
Video Views
Engagement Rate
We have more 60+ metrics and dimensions available for your business.
Feel free to connect and create your custom dashboard.
If your question is not answered here,
please Contact Us directly!
What is a LinkedIn analytics dashboard?
A LinkedIn analytics dashboard brings important LinkedIn Page performance metrics into one visual reporting view. It helps marketing teams and agencies monitor audience engagement, content performance, impressions, clicks, follower activity, and other LinkedIn KPIs without manually organizing data in spreadsheets.
What does the StatNexa LinkedIn integration do?
The StatNexa LinkedIn integration connects LinkedIn Page performance data with StatNexa so you can visualize key metrics in customizable dashboards and reports. It helps businesses and agencies monitor LinkedIn performance, analyze engagement trends, and include LinkedIn data in broader marketing reporting.
Which LinkedIn metrics can I track in StatNexa?
StatNexa supports LinkedIn performance metrics such as impressions, clicks, comments, likes, shares, engagement, engagement rate, follower engagement rate, video views, engaged viewers, and time watched. These metrics can help teams evaluate content visibility, audience interaction, and overall LinkedIn Page performance.
Can I create automated LinkedIn reports with StatNexa?
Yes. StatNexa can be used to automate LinkedIn reporting, reducing the need to manually collect and organize LinkedIn performance data for recurring reports. This is especially useful for agencies and marketing teams that regularly provide LinkedIn performance updates to clients or stakeholders.
Can I build a custom LinkedIn dashboard in StatNexa?
Yes. You can create a custom LinkedIn dashboard in StatNexa and focus it on the metrics that matter to your reporting goals. This allows you to build different views for content performance, engagement, audience activity, video performance, or client reporting instead of relying on a fixed reporting layout.
Can I combine LinkedIn data with other marketing channels in StatNexa?
Yes. LinkedIn data can be viewed alongside information from other connected marketing and analytics platforms in StatNexa. Combining multiple data sources can provide a more complete view of marketing performance and help teams compare LinkedIn results with other channels from a centralized reporting environment.
How can agencies use StatNexa for LinkedIn client reporting?
Agencies can use StatNexa to create LinkedIn dashboards and reports around the KPIs that matter to each client. Instead of manually preparing recurring LinkedIn reports, agencies can centralize performance data, customize the reporting view, and automate reporting workflows for more consistent client communication.
Which LinkedIn KPIs should I include in a client report?
The right KPIs depend on the client's LinkedIn goals. For brand awareness, metrics such as impressions and video views may be useful. For content engagement, teams can focus on clicks, likes, comments, shares, and engagement rate. Reports should prioritize metrics that directly relate to the client's objectives rather than including every available data point.
 Contact Us