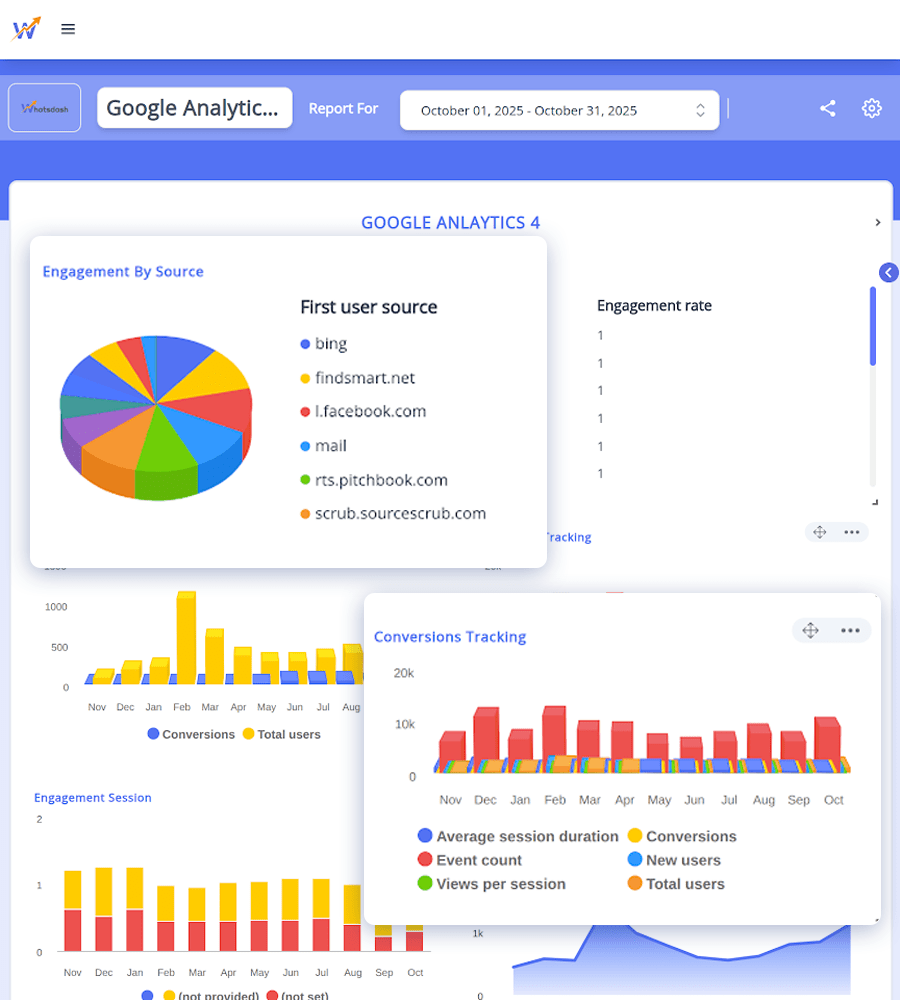
Streamline your reporting. Pull data from all your business tools, arrange key metrics and charts with a simple drag-and-drop dashboard builder, and view your performance clearly in one powerful dashboard.

Create dashboards tailored to your business. Save layouts as reusable templates and easily replicate them for other clients or projects—making reporting faster and smarter.

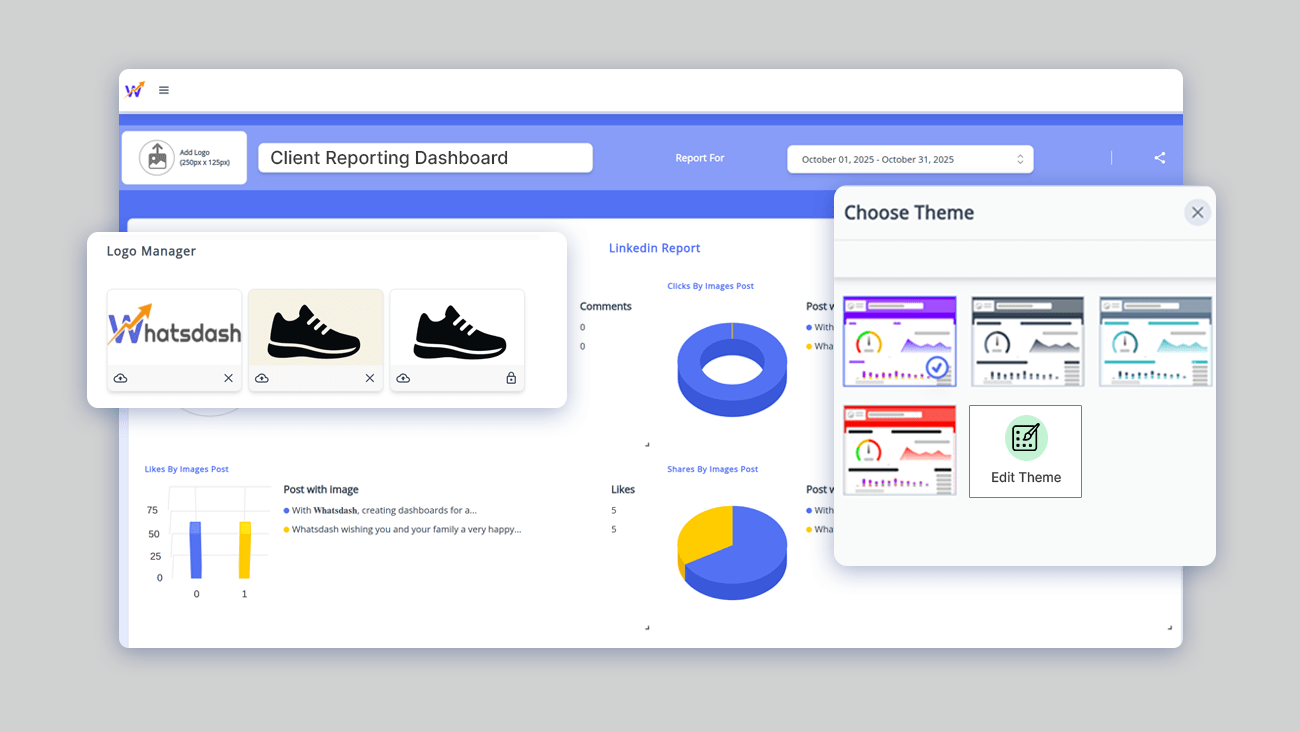
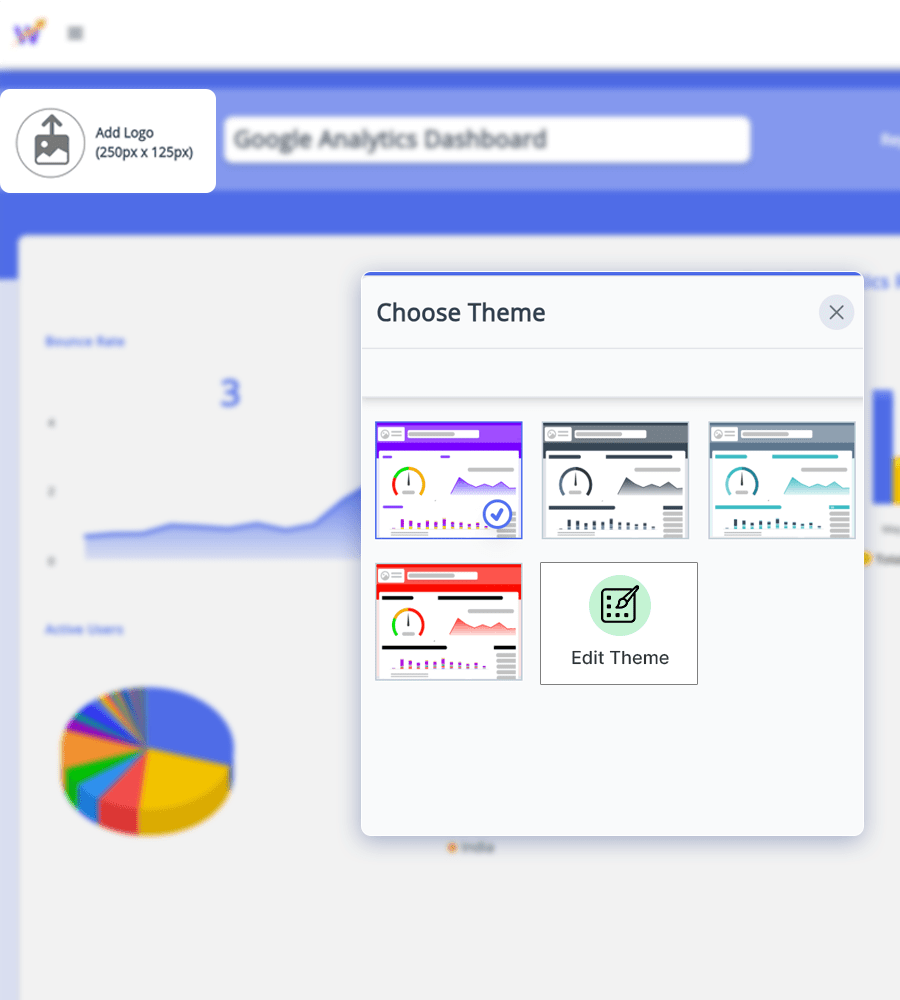
Showcase your business with a fully branded experience. Host dashboards on your own domain and highlight your logo, colours, and style for a professional, client-ready presentation.
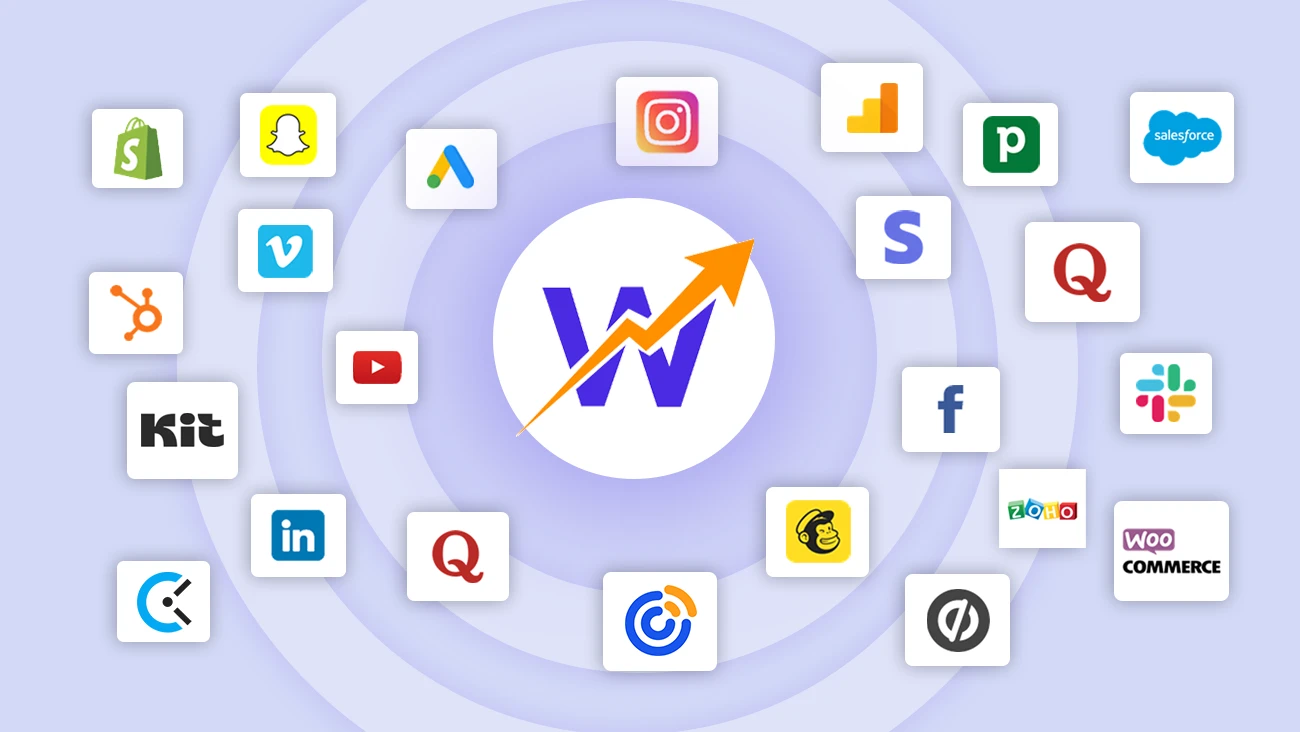
Connect all your business and client data in one place. With 90+ data platforms, you can easily pull metrics from your favourite tools to create comprehensive, real-time dashboards.
Schedule your dashboards and reports once and let them update automatically. Your latest business data is always ready, giving you accurate insights without any manual work.
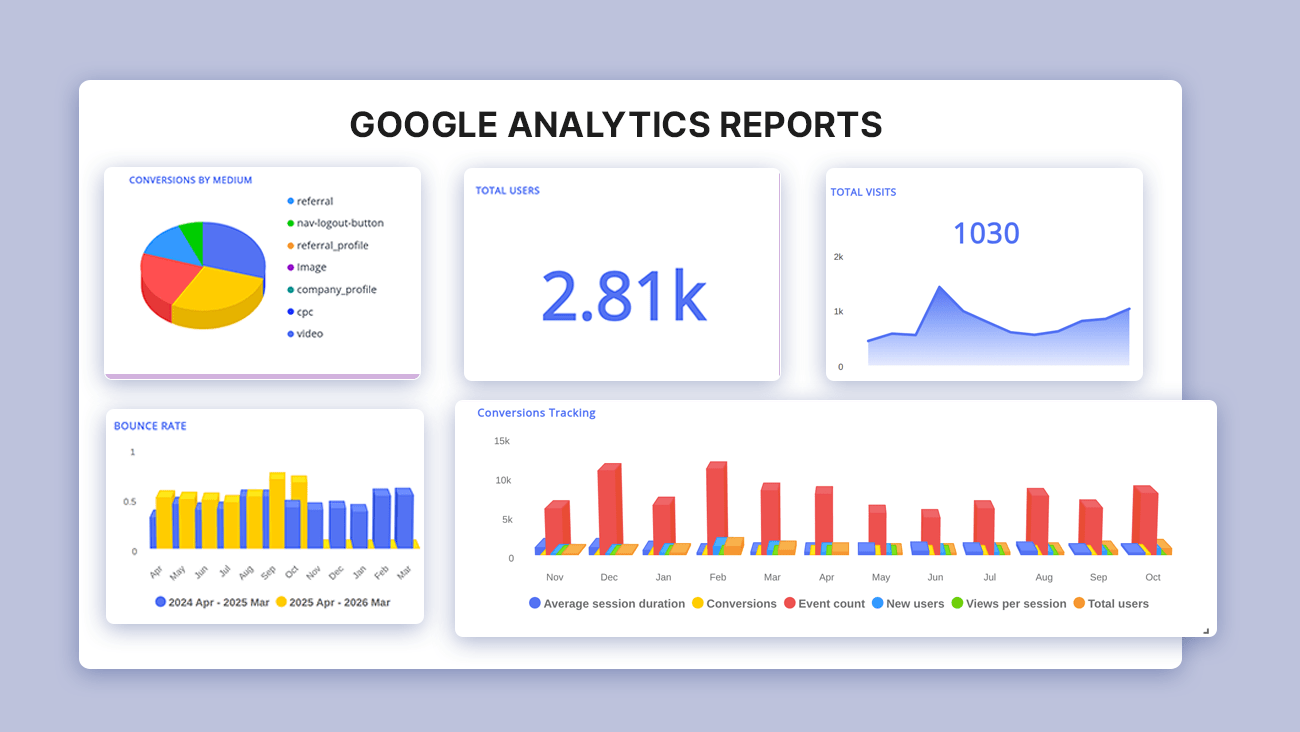
With this dashboard builder software easily creates fully customizable dashboards and reports. Drag and drop widgets like charts, headers, and comments, set your reporting period, and watch your data update automatically in real time. Highlight key insights, streamline reporting, and make smarter business decisions faster.
Design fully customizable dashboards with drag-and-drop dashboard template editor and showcase your brand with complete white-labeling. Deliver professional, client-ready reports that put your brand in the spotlight while highlighting key business insights.
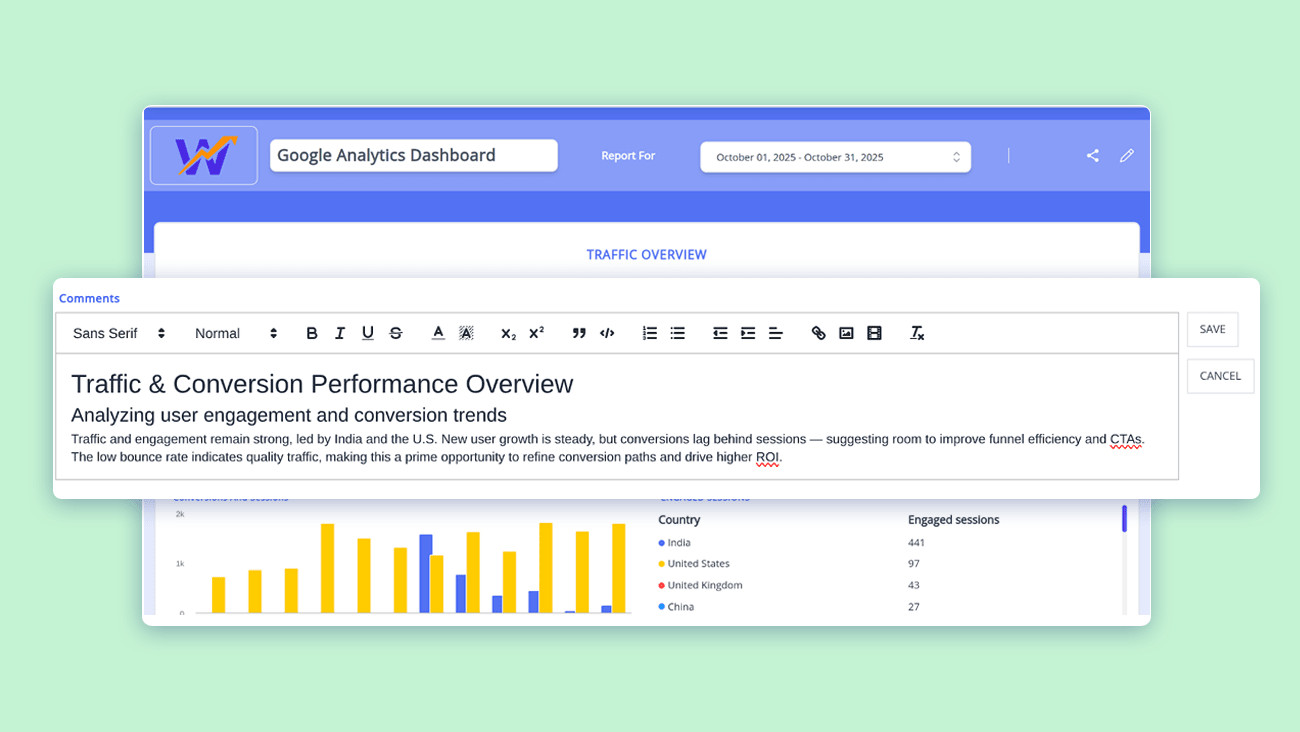
Transform your business metrics into meaningful insights effortlessly. Add custom comments and context alongside charts and widgets to explain performance in plain language. The intuitive dashboard and reporting tools make it easy to highlight key trends, share actionable recommendations, and scale your workflow, all while delivering personalized, client-ready insights that drive real results.
Stop juggling multiple tools and spreadsheets to track your business or clients’ metrics. Access real-time data from all your platforms in one place. Build, customize, and schedule dashboards and reports effortlessly, monitor performance, and streamline your workflow, all from a single intuitive interface. Simplify reporting, save time, and scale your business with ease.
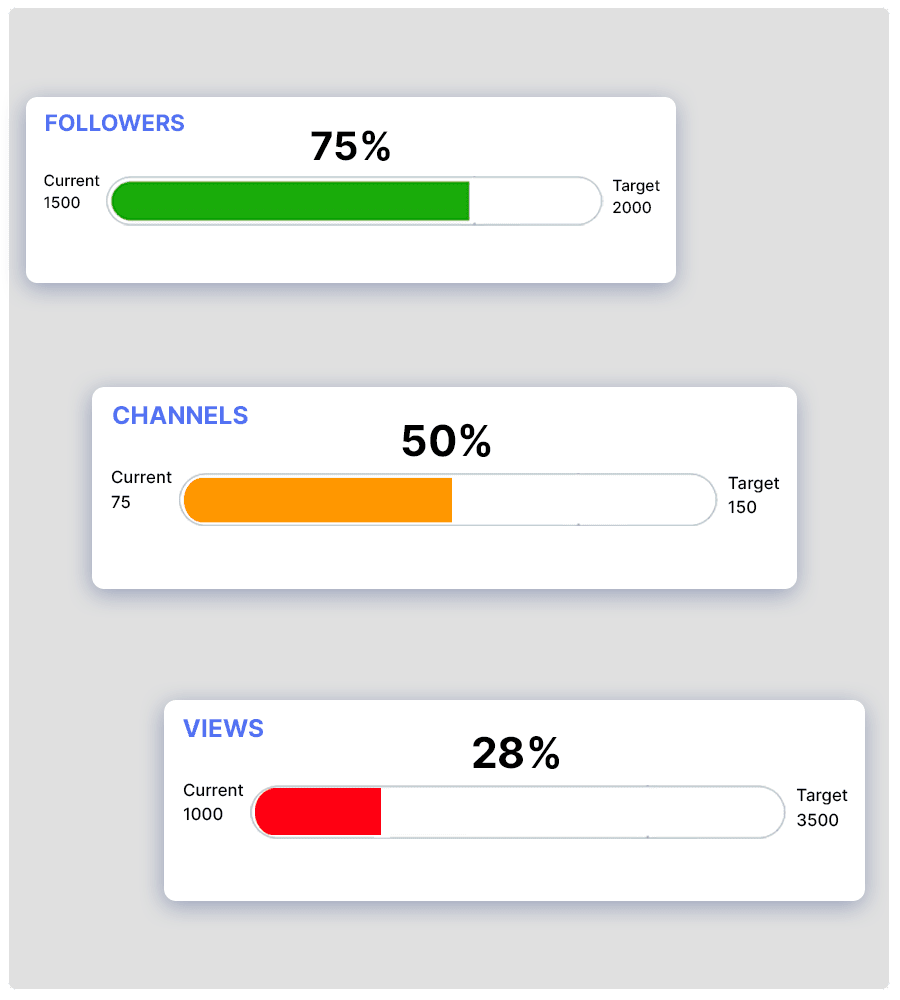
Automate your business reporting in minutes with customizable reporting widgets and ready-to-use report templates. Easily gather data from multiple platforms, create comprehensive reports, and showcase key metrics in one central dashboard or live report. No more switching between spreadsheets or tools—highlight the KPIs and insights that truly matter and demonstrate your business performance with clarity and impact.
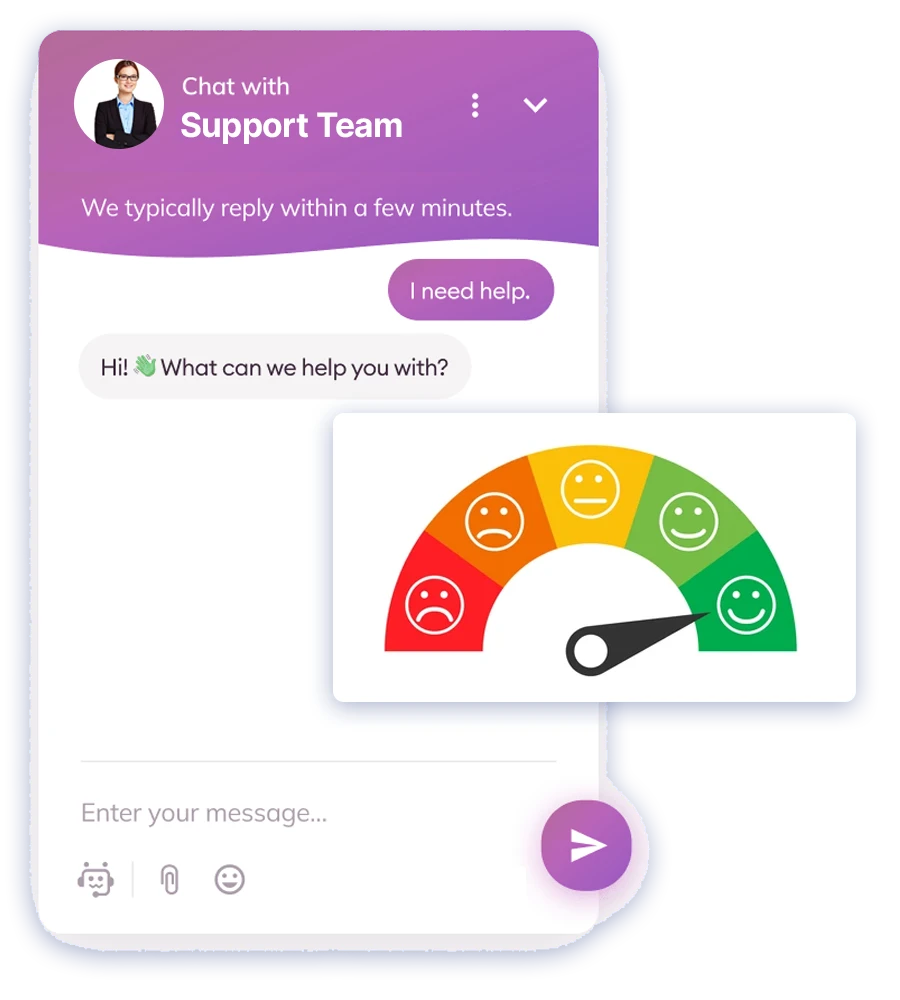
24/5, live chat support is available, fast and reliable;
...
often responding within minutes so you’re never left waiting. Beyond speed, we focus on delivering exceptional assistance, consistently earning high customer satisfaction ratings.
We are committed to helping your business succeed. Our expert support team provides guidance to maximize the platform, build insightful dashboards, and deliver professional, data-driven reports with ease.
More
Your brand is front and centre in every report ... and dashboard. From fully customizable layouts to branded URLs, every dashboard you create reflects your business identity, polished, professional, and designed to match how you operate. Impress clients, reinforce your brand, and showcase results with dashboards that feel entirely your own. More
With 90+ built-in integrations, brings together ... performance across sales, marketing, eCommerce, finance, and more in a single, branded dashboard. Access all your key metrics in real time, eliminate the need to switch between platforms, and provide a clear, comprehensive view of your business performance. More
Automate your business reporting and focus
...
on what really matters. Pull key metrics from 90+ integrated platforms into professional, branded dashboards, eliminating manual data collection and consolidating insights in one place.
Use cross-platform reporting to combine analytics from sales, marketing, eCommerce, and finance tools, giving a complete and accurate view of your business performance. Customize dashboards and report templates to fit your needs, then clone them to quickly onboard new clients or projects, saving time and scaling your business efficiently. Highlight the metrics that matter most, showcase results clearly, and make smarter, data-driven decisions with ease.
More
A drag-and-drop dashboard builder is a visual reporting tool that lets users create dashboards by positioning charts, KPIs, tables, and other widgets without coding. It simplifies dashboard creation for marketing teams, agencies, and businesses that need flexible ways to organize and visualize performance data.
No. StatNexa works as a no-code dashboard builder, allowing users to create and customize reporting dashboards visually. Teams can organize dashboard widgets, KPIs, charts, and reporting elements without writing code, making dashboard creation accessible to marketers, analysts, agencies, and other non-technical users.
A visual dashboard builder lets you customize how metrics and reporting elements are presented. You can organize KPIs, charts, widgets, text, and other visual elements into layouts that match specific reporting needs, helping create clearer dashboards for different clients, campaigns, teams, or business objectives.
Yes. A multi-source dashboard can bring performance data from different marketing and business platforms into one reporting view. With StatNexa, teams can connect supported data sources and organize their most important cross-channel KPIs into customized dashboards instead of reviewing each platform separately.
Yes. Reusable dashboard templates allow agencies and teams to replicate successful reporting structures instead of rebuilding dashboards from scratch. A proven layout can be adapted for another client, campaign, project, or reporting workflow, helping reduce dashboard setup time while keeping reporting consistent.
A drag-and-drop dashboard builder simplifies marketing reporting by giving teams control over how performance data is organized and presented. Important KPIs can be grouped into clear visual reports, making it easier to monitor campaigns, communicate results, identify performance changes, and create dashboards suited to different stakeholders.