
Turn Google BigQuery Data into AI-Powered Business Intelligence
One Cloud Warehouse. Unlimited Business Intelligence.
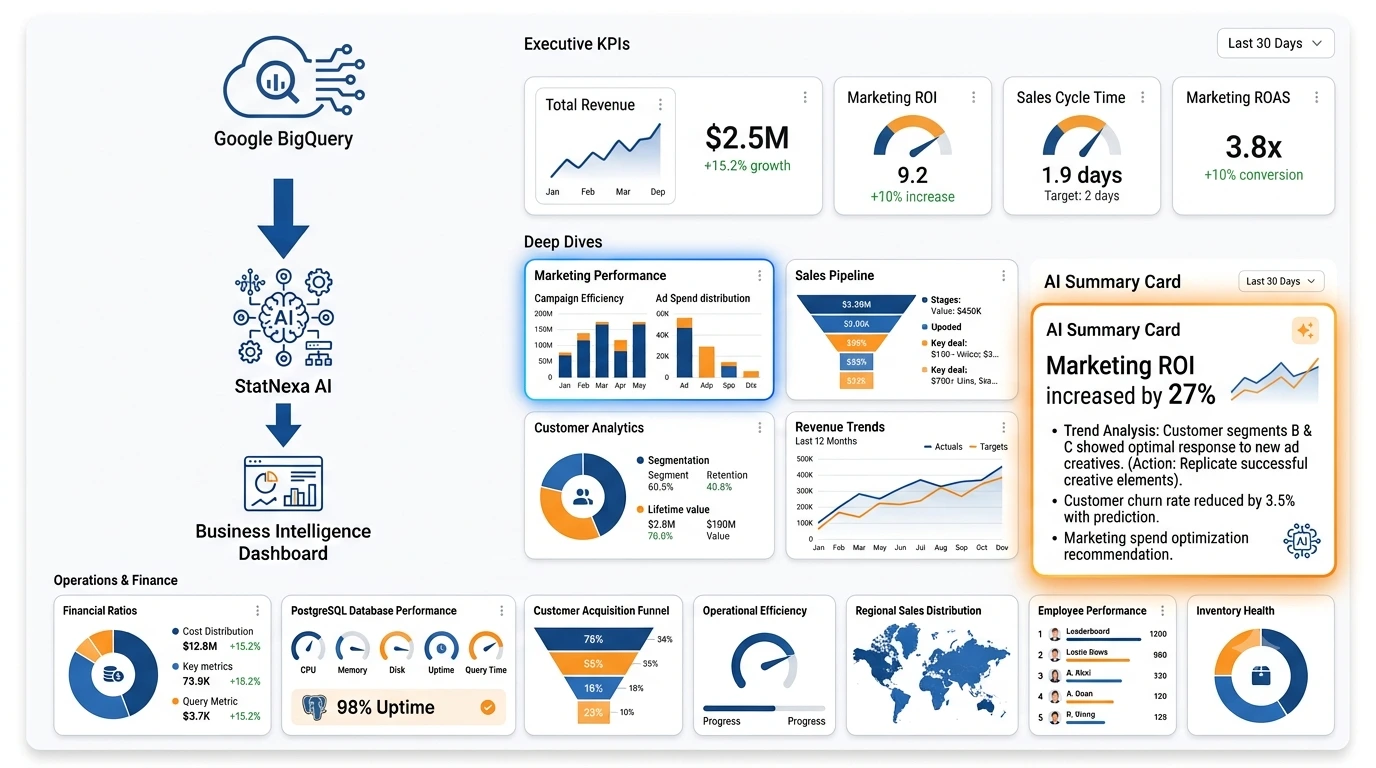
Google BigQuery stores billions of rows of marketing, sales, finance, and customer data.
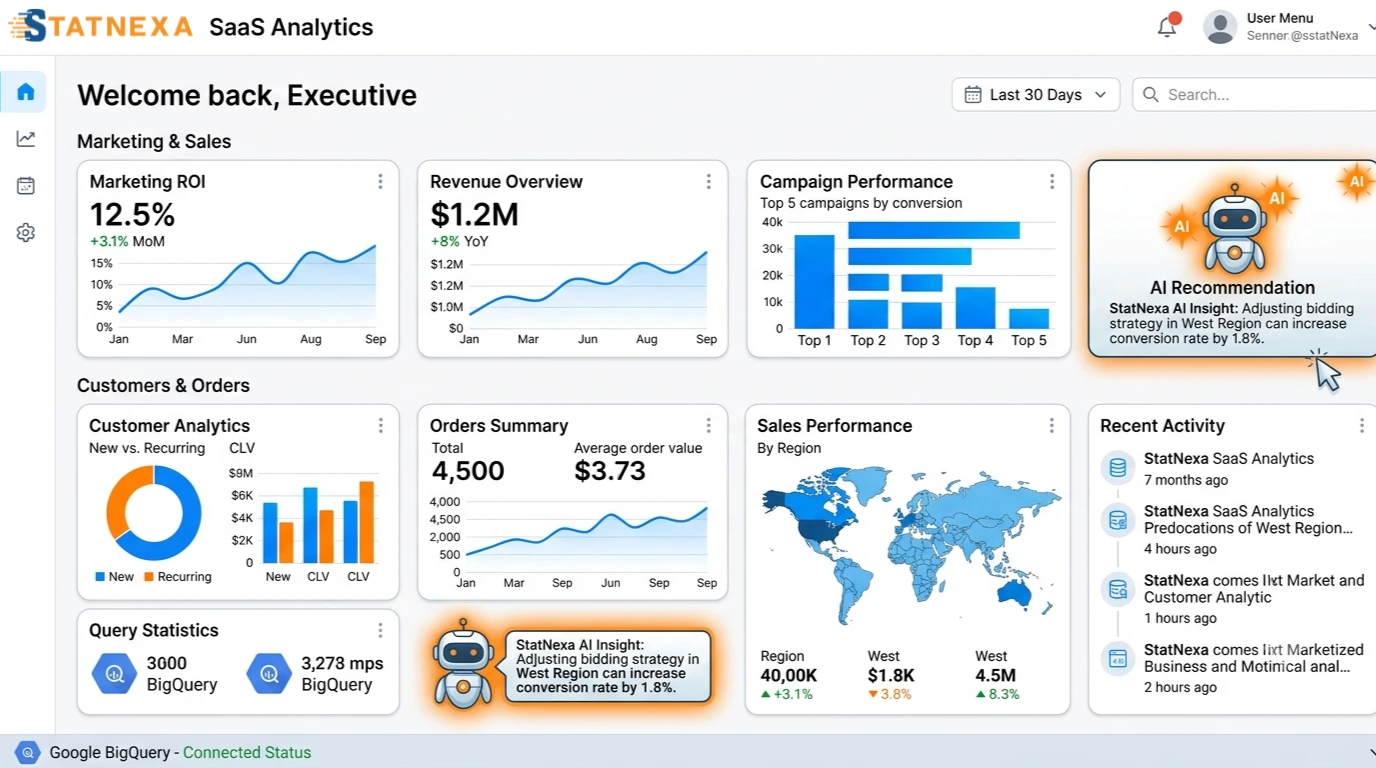
StatNexa connects directly to BigQuery and automatically transforms cloud warehouse data into interactive dashboards, AI-generated reports, and executive-ready insights. Instead of writing complex SQL queries and exporting data, your teams receive real-time intelligence that helps improve decision-making across every department.
Everything You Need to Transform BigQuery Data into Actionable Intelligence
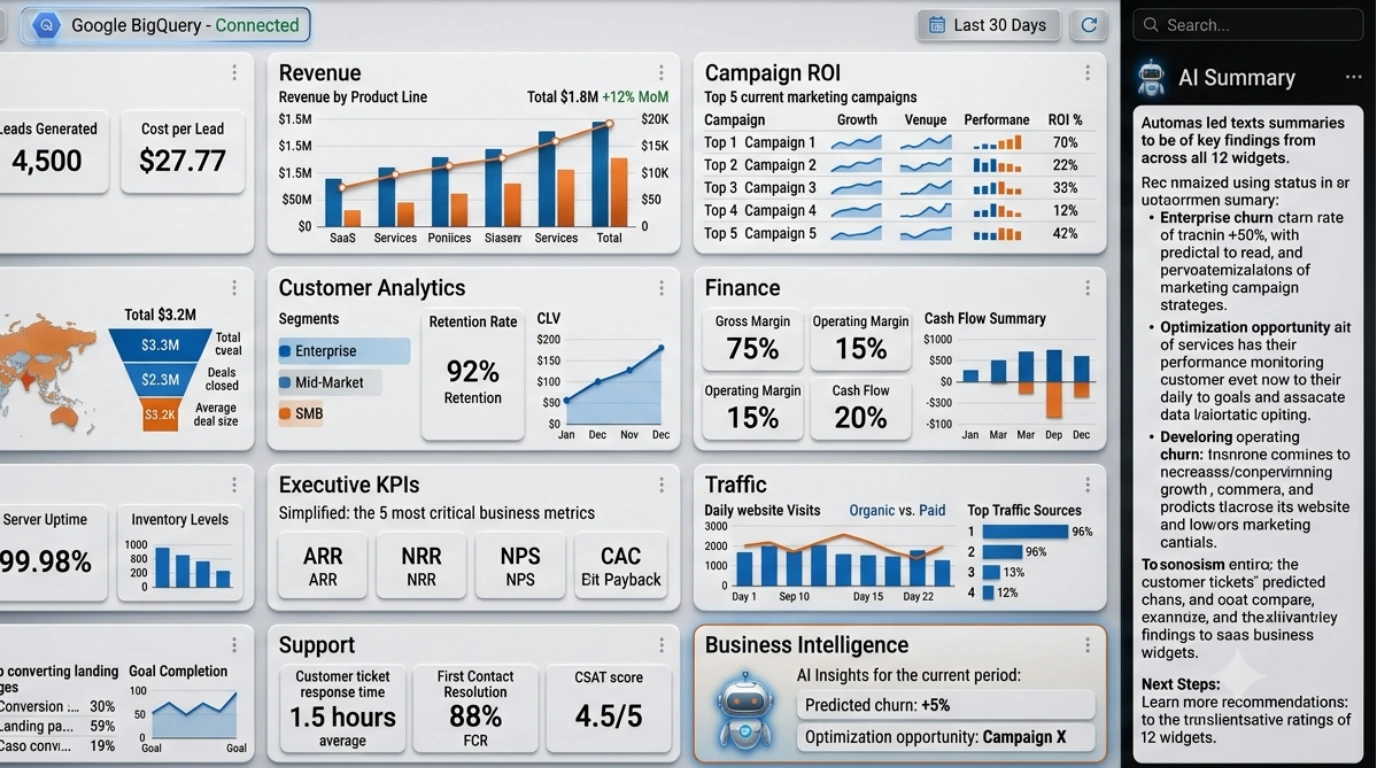
StatNexa combines Google BigQuery connectivity, automation, AI-powered reporting, and interactive dashboards into one intelligent reporting platform.
Monitor enterprise KPIs, analyze marketing performance, identify trends, generate executive summaries, and deliver client-ready reports without manually exporting warehouse data.
Meet Your AI Reporting Assistant
Imagine opening your dashboard every morning and instantly understanding what changed across your marketing and business data.Instead of manually querying BigQuery tables, StatNexa continuously analyzes your cloud warehouse and highlights the insights that matter most.
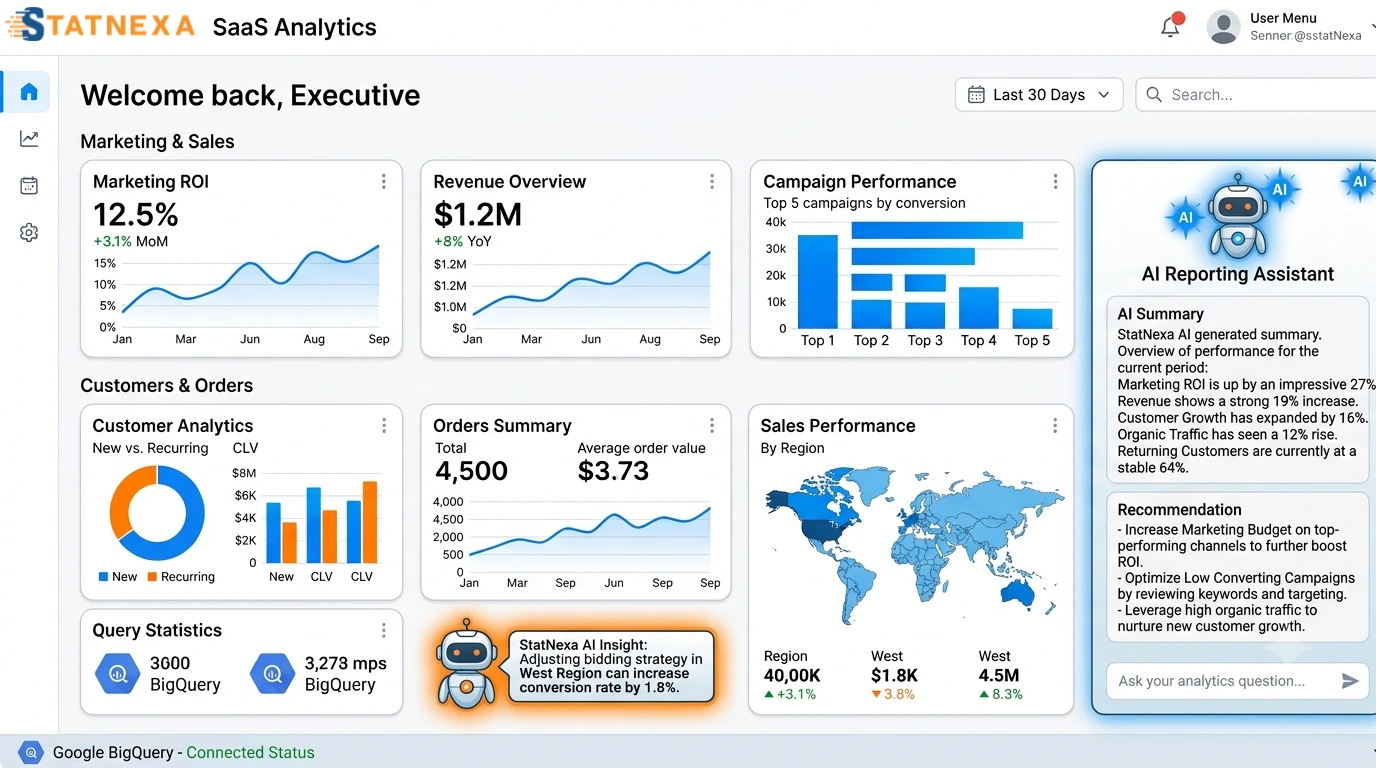
AI Business Insights
- 📈 Marketing ROI increased by 27%
- 👥 Customer acquisition increased by 16%
- 💰 Revenue increased by 19%
- 📊 Organic traffic increased by 12%
- ⭐ Returning customers generated 64% of total revenue
AI Recommendation
Increase investment in your highest-performing acquisition channels and optimize campaigns with declining conversion rates.
Experience AI-Powered ReportingReplace Manual BigQuery Reporting with AI Automation
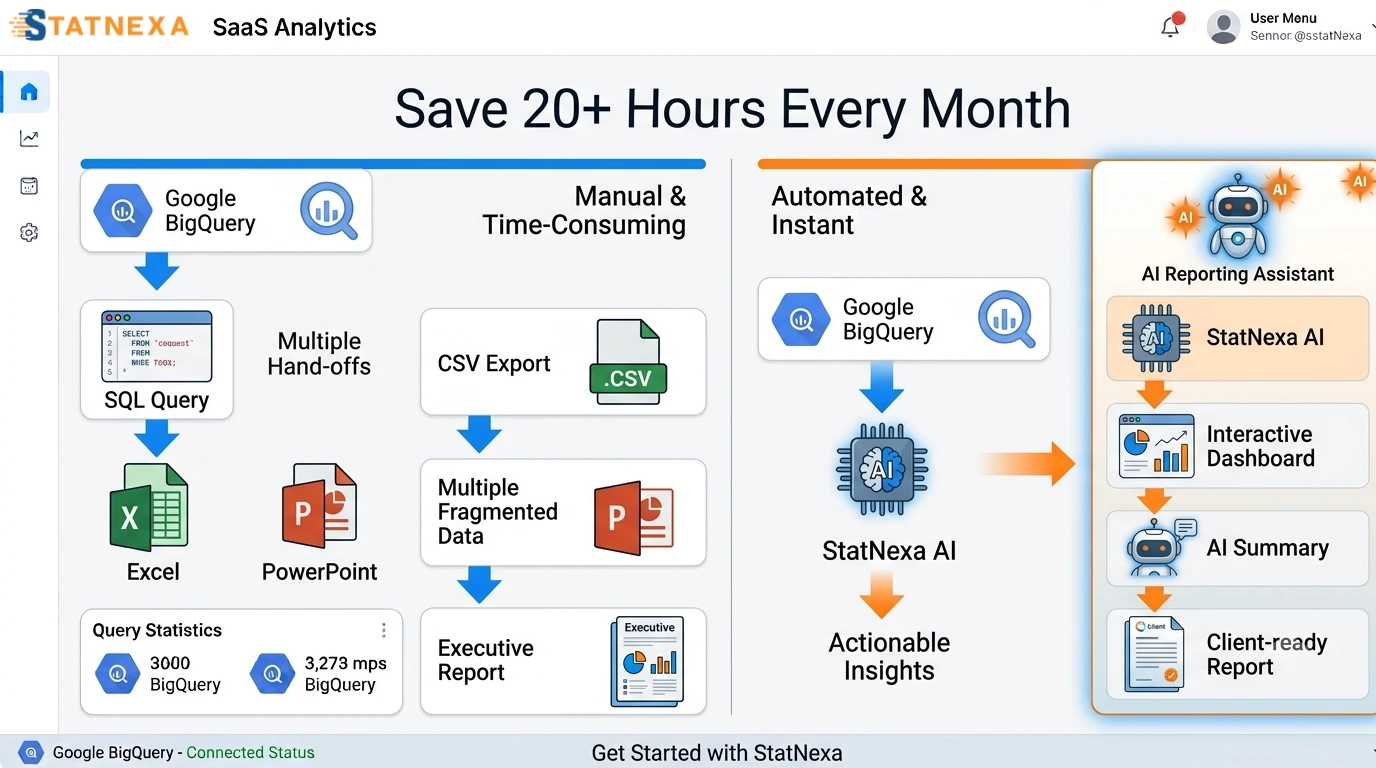
Traditional BigQuery reporting often requires writing SQL queries, exporting datasets, building spreadsheets, and creating executive presentations.
StatNexa automates the reporting workflow so your team spends less time preparing reports and more time acting on insights.
Build Dashboards for Every Business Team
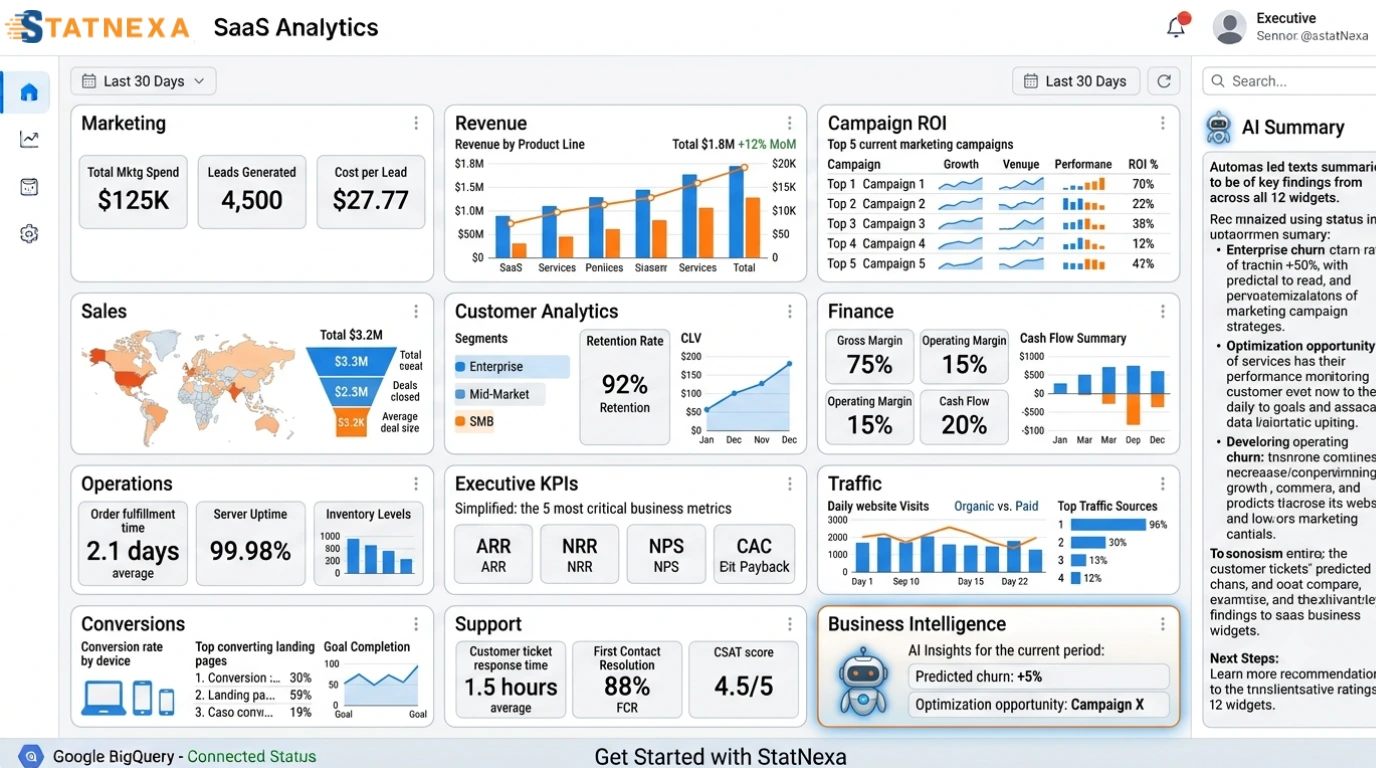
Transform Google BigQuery data into interactive dashboards for every department.
Monitor marketing campaigns, customer analytics, ecommerce, finance, operations, sales, executive KPIs, and custom business metrics from one centralized reporting platform.
Ready to Turn Google BigQuery Data into Business Intelligence?
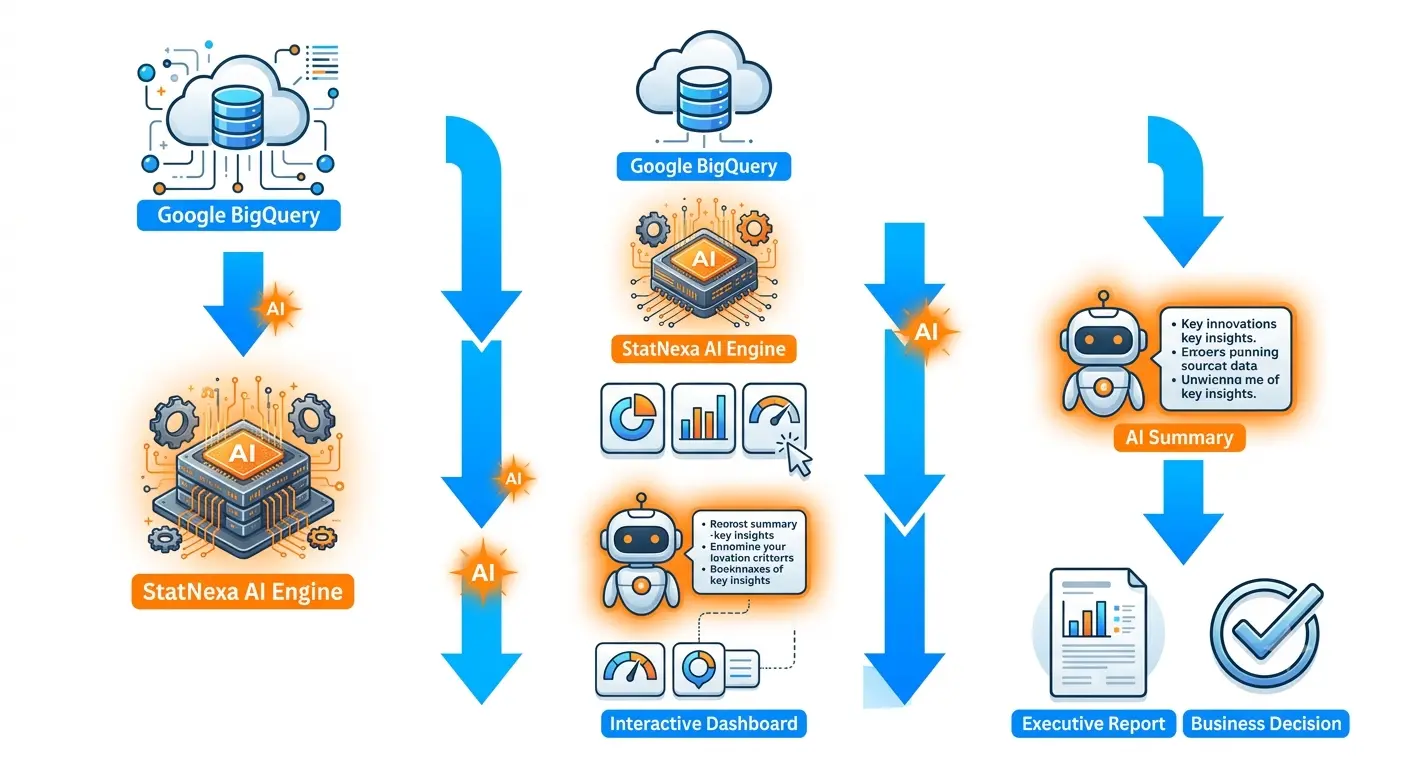
Stop exporting cloud warehouse data manually.
Connect Google BigQuery once and let StatNexa automatically generate AI-powered reports, dashboards with AI Insights, and executive business intelligence that helps your organization make faster, smarter decisions.
If your question is not answered here,
please Contact Us directly!
How can Google BigQuery data be turned into business intelligence?
StatNexa connects directly to BigQuery and transforms large cloud datasets into AI-powered dashboards, reports, and actionable insights.Teams can analyze marketing, sales, finance, ecommerce, and customer data from one centralized platform.
What Google BigQuery metrics can I analyze with StatNexa?
You can analyze business KPIs across marketing, sales, customer behavior, ecommerce, finance, and operations. StatNexa helps turn complex warehouse data into visual dashboards and executive-ready reports.
Can I automate BigQuery reporting without manually exporting data?
Yes. StatNexa automates the reporting workflow and reduces repetitive SQL queries, dataset exports, spreadsheets, and manual report creation. This allows teams to spend less time preparing reports and more time acting on insights.
How does AI analyze Google BigQuery data?
StatNexa continuously analyzes connected BigQuery data to identify trends, performance changes, and important business insights. Its AI reporting can generate summaries and recommendations to help teams make faster decisions.
Can I create BigQuery dashboards for different business teams?
Yes. StatNexa lets teams build interactive dashboards for marketing, sales, finance, ecommerce, operations, customer analytics, and executive KPIs. Each dashboard can focus on the metrics and insights most relevant to that department.
Can Google BigQuery support real-time business intelligence reporting?
Yes. StatNexa transforms connected BigQuery warehouse data into interactive dashboards and AI-powered reports for timely business intelligence. This gives teams faster visibility into changing KPIs and helps support data-driven decisions.
 Contact Us