
Turn Google Sheets into AI-Powered Business Intelligence
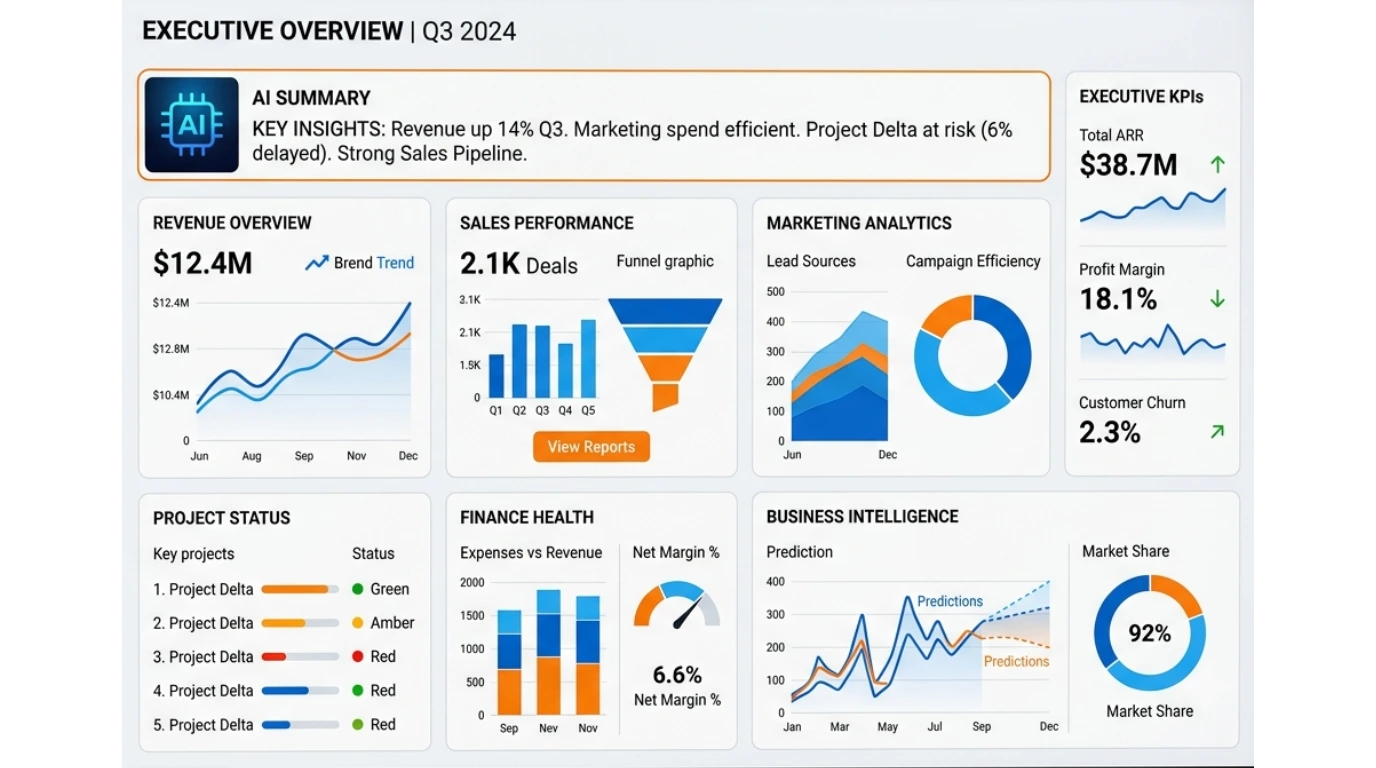
One Spreadsheet. Unlimited Business Insights.
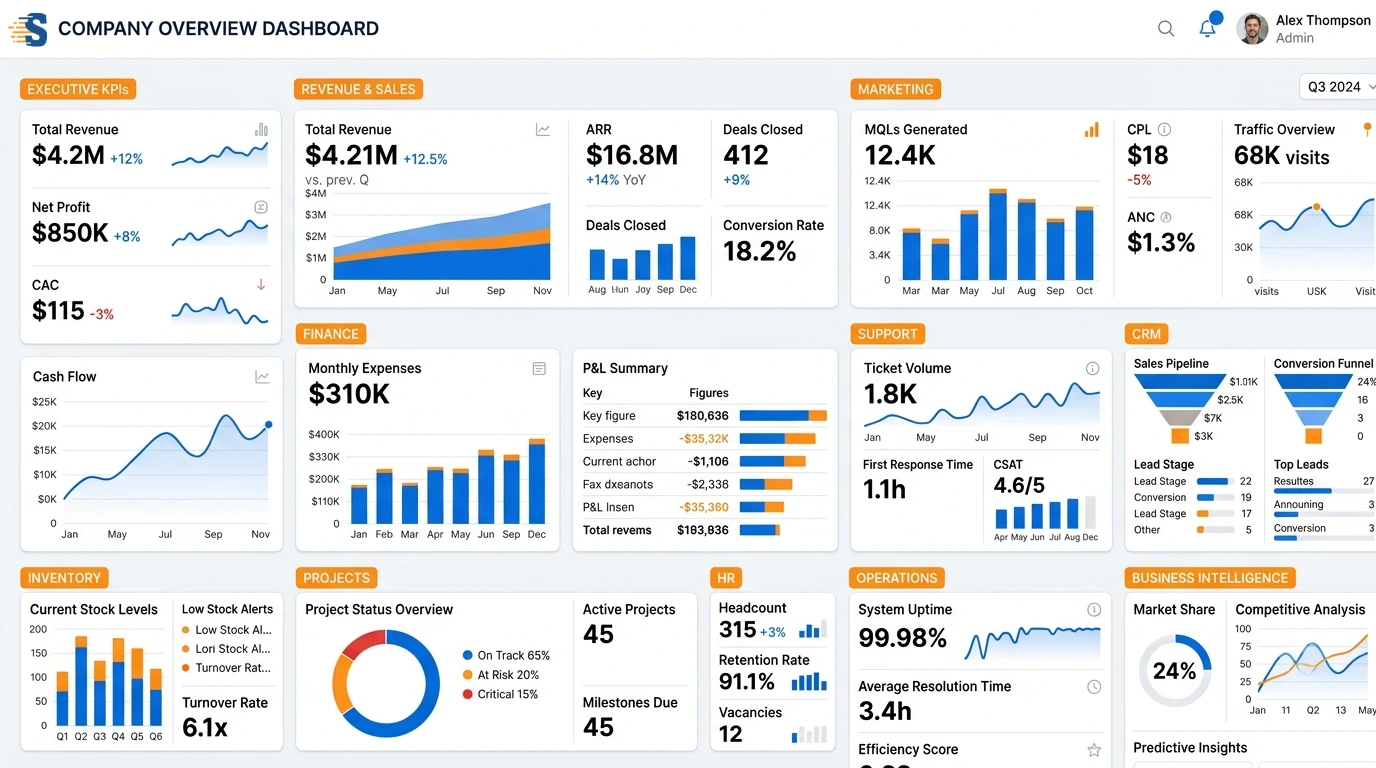
Google Sheets is where many businesses manage their most important information—Sales, Budgets, Marketing, Projects, Finance, and HR.
Instead of manually updating charts and reports every week, StatNexa connects directly to Google Sheets and automatically transforms spreadsheet data into interactive dashboards, AI-generated reports, and business intelligence.
Everything You Need to Transform Spreadsheet Data into Actionable Intelligence
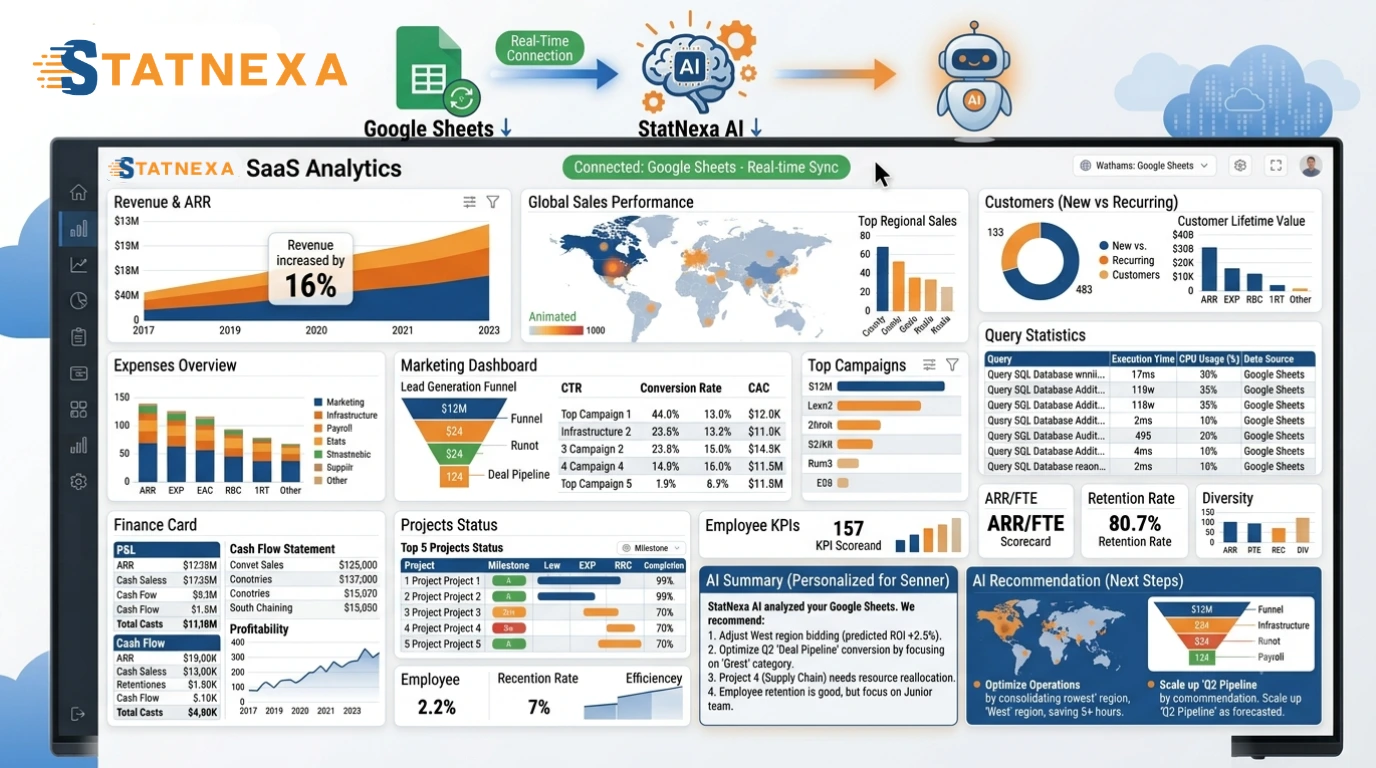
StatNexa combines Google Sheets connectivity, AI-powered reporting, automation, and interactive dashboards into one intelligent reporting platform.
Visualize your spreadsheet data, monitor KPIs, identify trends automatically, and deliver professional reports without manually creating charts.
Meet Your AI Reporting Assistant
Imagine opening your dashboard every morning and instantly understanding what changed in your spreadsheets.Instead of reviewing rows, columns, and formulas manually, StatNexa continuously analyzes your Google Sheets data and highlights the insights that matter most.
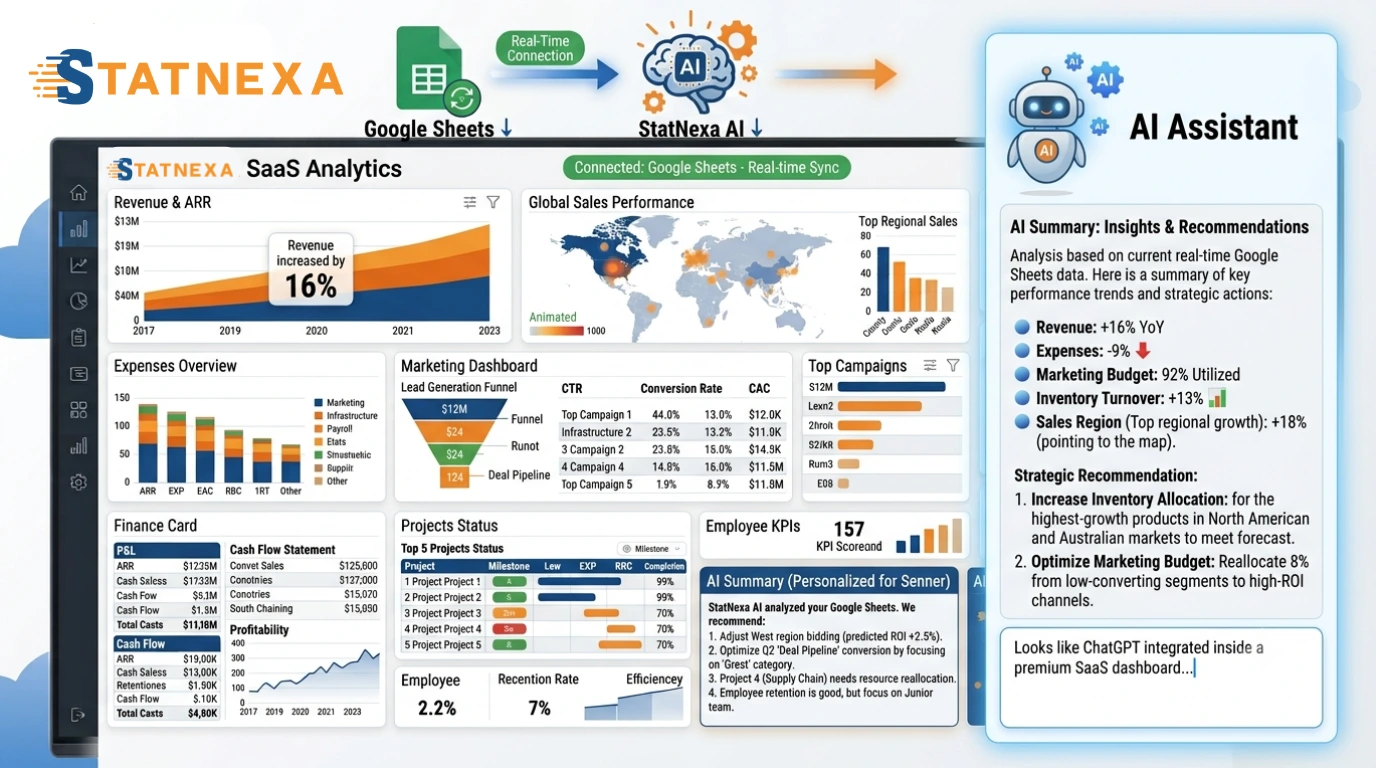
AI Business Insights
- 📈 Revenue increased by 16%
- 💰 Expenses reduced by 9%
- 📊 Marketing budget utilization reached 92%
- 📦 Inventory turnover improved by 13%
- ⭐ Best-performing sales region exceeded target by 18%
AI Recommendation
Increase inventory for your highest-selling products and reallocate unused marketing budget toward top-performing campaigns.
Experience AI-Powered ReportingReplace Manual Spreadsheet Reporting with AI Automation
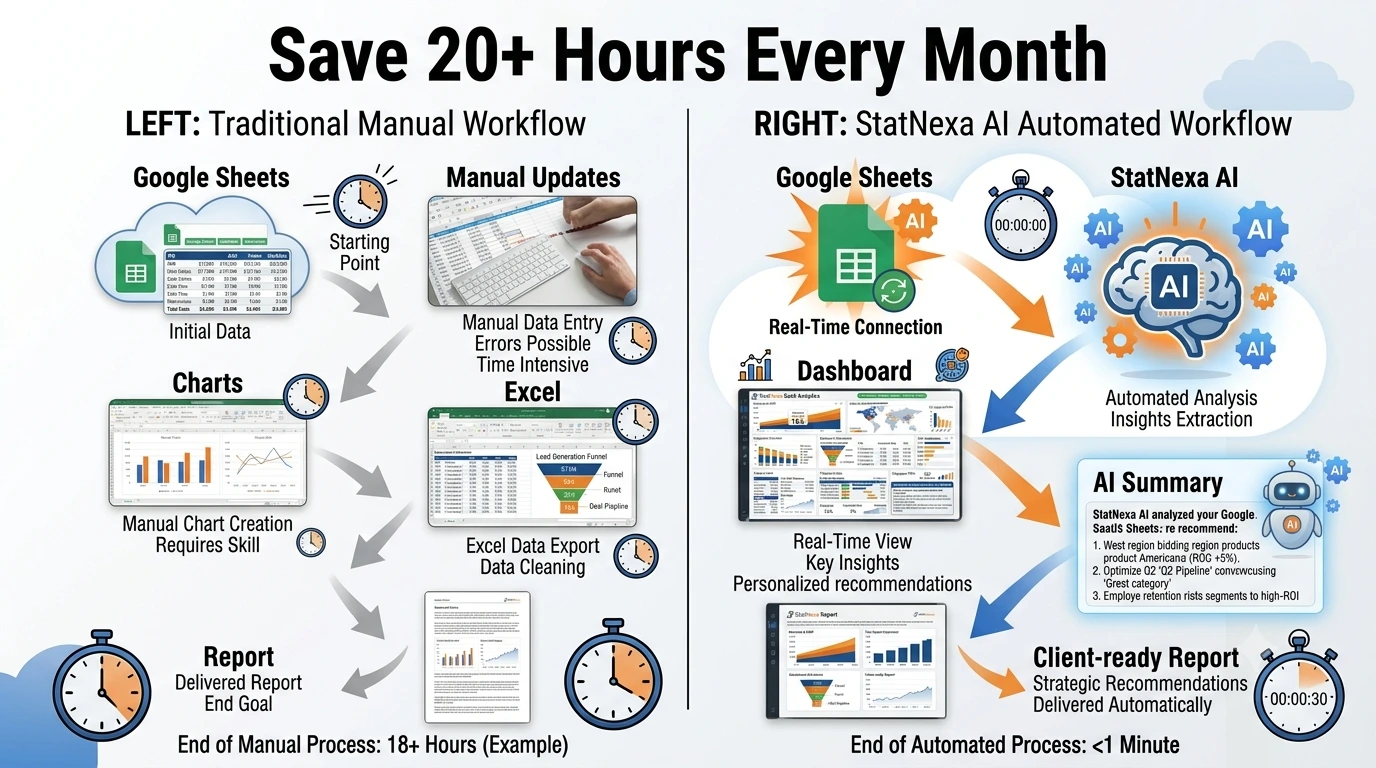
Traditional spreadsheet reporting requires updating formulas, building charts, copying data, and creating presentations manually.
StatNexa automatically transforms your Google Sheets into interactive dashboards, AI-generated reports, and executive-ready insights—so your team can focus on making decisions instead of updating spreadsheets.
Build Dashboards for Every Team
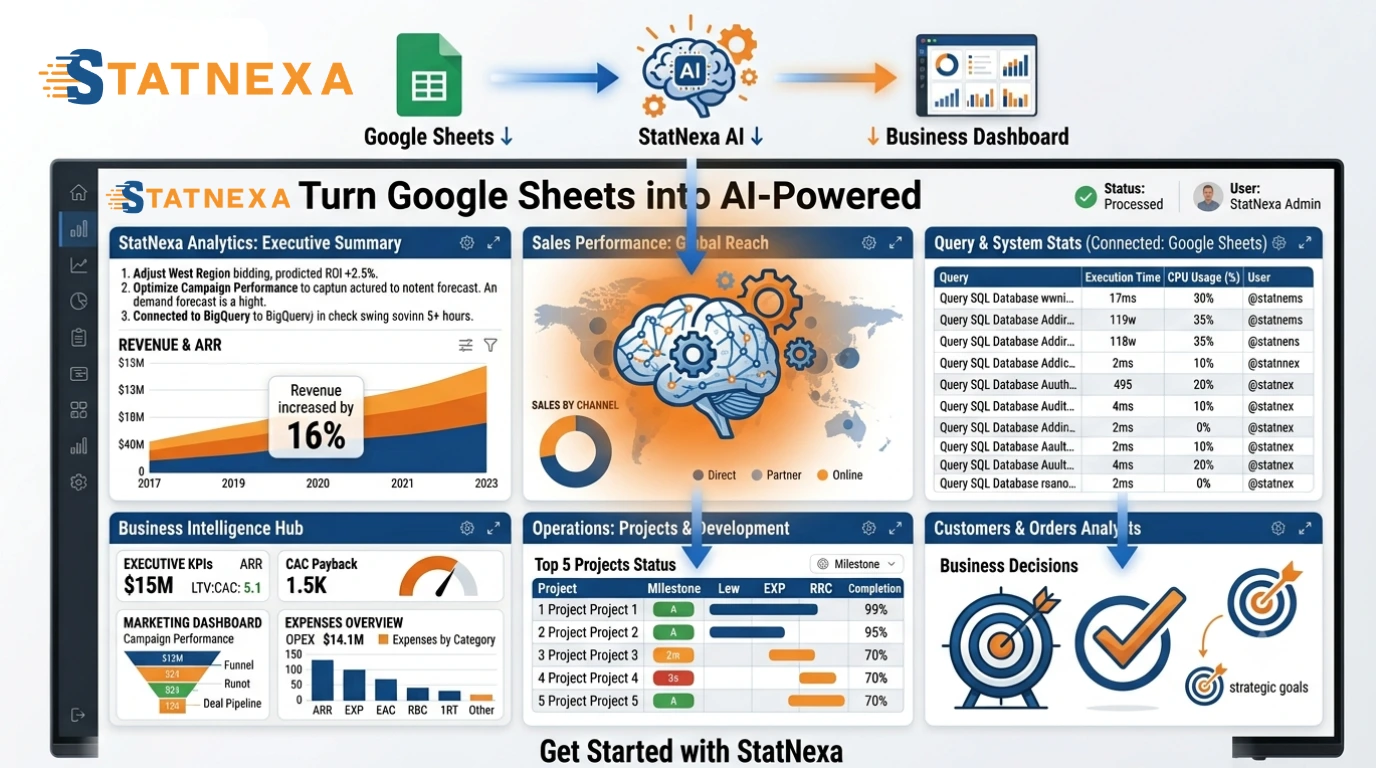
Transform spreadsheet data into dashboards for every department.
Monitor Sales, Finance, Marketing, Inventory, HR, Projects, Operations, CRM, Customer Support, Executive KPIs, Custom Metrics, and Business Performance—all from one intelligent reporting platform.
Ready to Turn Google Sheets into Business Intelligence?
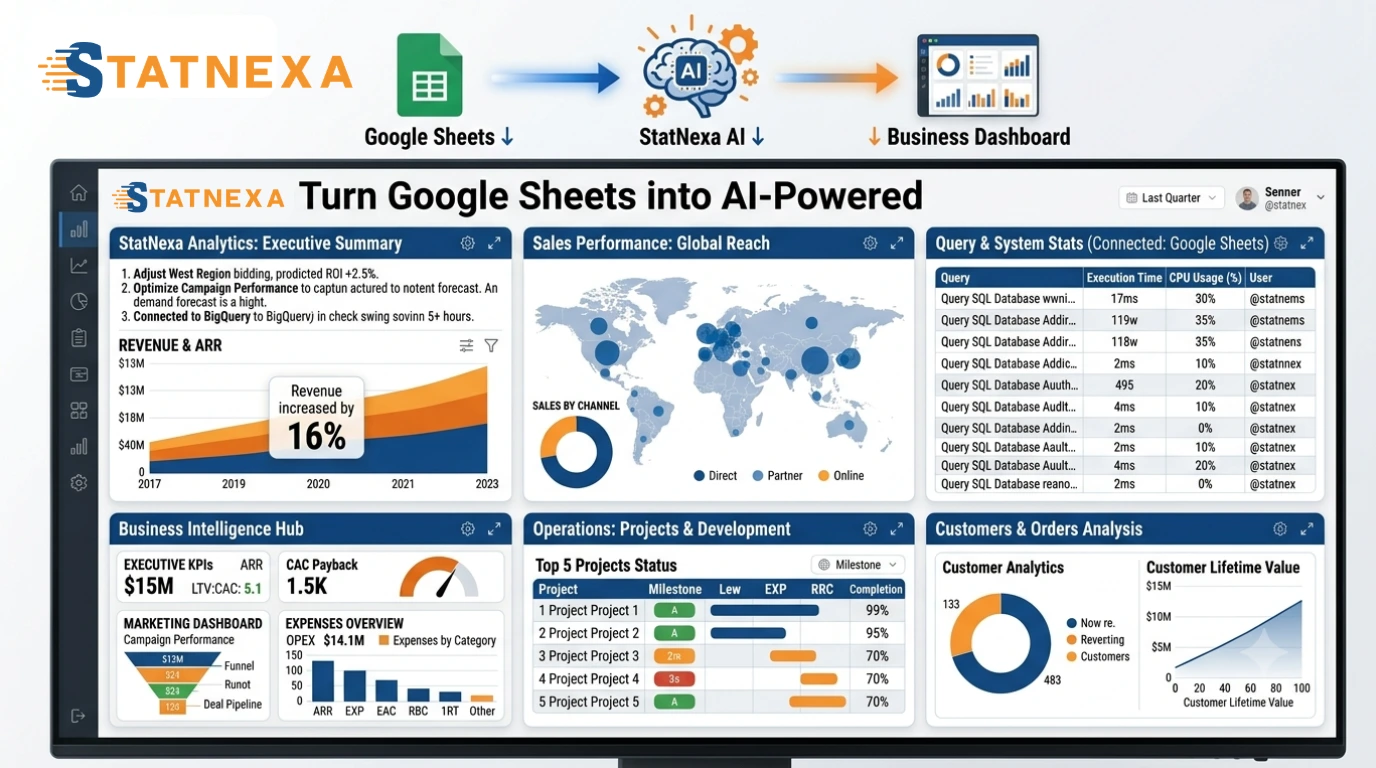
Stop building reports manually.
Connect Google Sheets once and let StatNexa automatically generate AI-powered reports, dashboards with AI Insights, and client-ready business intelligence that helps your team make faster, smarter decisions.
If your question is not answered here,
please Contact Us directly!
What is Google Sheets reporting?
Google Sheets reporting transforms spreadsheet data into dashboards, KPIs, visual reports, and actionable business insights. StatNexa automates this process so teams can analyze performance without manually creating charts and reports.
Can I create a dashboard from Google Sheets?
Yes. StatNexa connects directly to Google Sheets and converts spreadsheet data into interactive, customizable dashboards. You can monitor sales, marketing, finance, HR, inventory, operations, and other business KPIs in one place.
How can I automate Google Sheets reporting?
Connect your Google Sheet to StatNexa once and automate dashboards, reports, data visualization, and AI-generated insights. This reduces manual spreadsheet updates, chart creation, data copying, and recurring report preparation.
Can AI analyze Google Sheets data?
Yes. StatNexa continuously analyzes Google Sheets data to identify trends, performance changes, and important business insights. Its AI reporting can also provide recommendations based on revenue, expenses, marketing, inventory, and other KPIs.
Can Google Sheets data be converted into business intelligence?
Yes. StatNexa transforms spreadsheet data into AI-powered reports, interactive dashboards, and actionable business intelligence. Teams can turn existing spreadsheet information into clearer insights without rebuilding their data in another system.
Can I create white-label and client-ready Google Sheets reports?
Yes. StatNexa can turn Google Sheets data into professional, client-ready and white-label dashboards and reports. This is useful for agencies and businesses that need branded reporting without manually preparing presentations or spreadsheets.
 Contact Us